4900 Oldbridge Dr Columbus, OH 43220
Estimated Value: $1,248,678 - $1,469,000
5
Beds
4
Baths
4,477
Sq Ft
$307/Sq Ft
Est. Value
About This Home
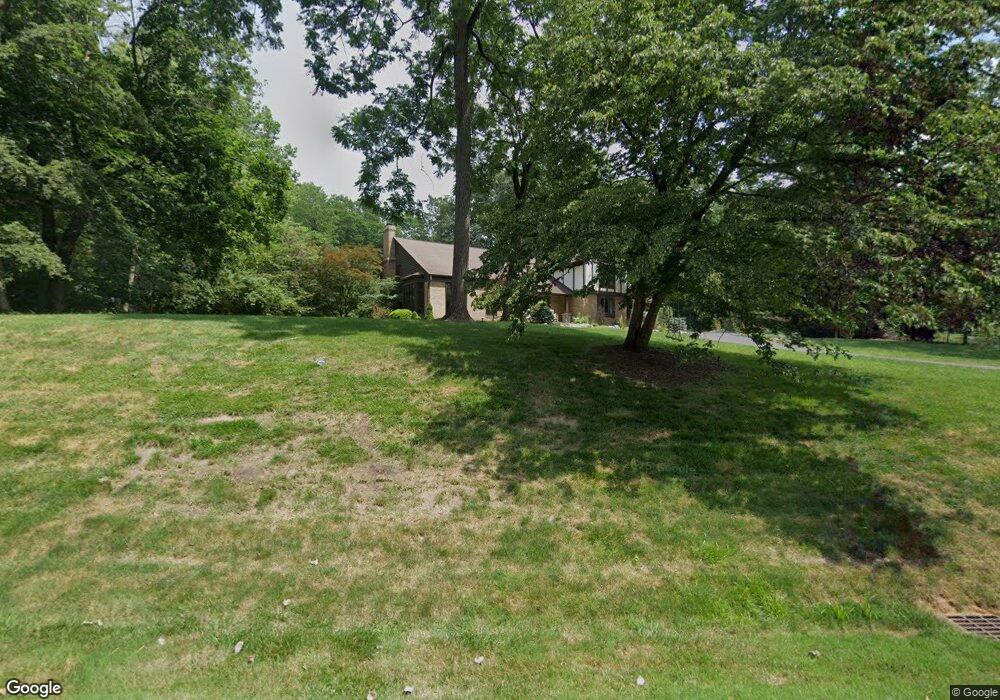
This home is located at 4900 Oldbridge Dr, Columbus, OH 43220 and is currently estimated at $1,373,559, approximately $306 per square foot. 4900 Oldbridge Dr is a home located in Franklin County with nearby schools including Greensview Elementary School, Hastings Middle School, and Upper Arlington High School.
Ownership History
Date
Name
Owned For
Owner Type
Purchase Details
Closed on
Apr 14, 2014
Sold by
Mellon Daniel P and Mellon Lynn A
Bought by
Wood Asa O
Current Estimated Value
Home Financials for this Owner
Home Financials are based on the most recent Mortgage that was taken out on this home.
Original Mortgage
$690,000
Outstanding Balance
$523,936
Interest Rate
4.31%
Mortgage Type
New Conventional
Estimated Equity
$849,623
Purchase Details
Closed on
Oct 4, 2005
Sold by
Maclaurin Sharon S and Maclaurin John P
Bought by
Mellon Daniel P and Mellon Lynn A
Home Financials for this Owner
Home Financials are based on the most recent Mortgage that was taken out on this home.
Original Mortgage
$305,000
Interest Rate
5.83%
Mortgage Type
Fannie Mae Freddie Mac
Create a Home Valuation Report for This Property
The Home Valuation Report is an in-depth analysis detailing your home's value as well as a comparison with similar homes in the area
Home Values in the Area
Average Home Value in this Area
Purchase History
| Date | Buyer | Sale Price | Title Company |
|---|---|---|---|
| Wood Asa O | $920,000 | None Available | |
| Mellon Daniel P | $905,000 | Title First |
Source: Public Records
Mortgage History
| Date | Status | Borrower | Loan Amount |
|---|---|---|---|
| Open | Wood Asa O | $690,000 | |
| Previous Owner | Mellon Daniel P | $305,000 |
Source: Public Records
Tax History Compared to Growth
Tax History
| Year | Tax Paid | Tax Assessment Tax Assessment Total Assessment is a certain percentage of the fair market value that is determined by local assessors to be the total taxable value of land and additions on the property. | Land | Improvement |
|---|---|---|---|---|
| 2024 | $20,164 | $348,290 | $105,210 | $243,080 |
| 2023 | $19,914 | $348,285 | $105,210 | $243,075 |
| 2022 | $27,831 | $393,790 | $105,140 | $288,650 |
| 2021 | $24,387 | $393,790 | $105,140 | $288,650 |
| 2020 | $24,278 | $393,790 | $105,140 | $288,650 |
| 2019 | $22,084 | $316,090 | $105,140 | $210,950 |
| 2018 | $21,837 | $316,090 | $105,140 | $210,950 |
| 2017 | $21,810 | $316,090 | $105,140 | $210,950 |
| 2016 | $21,870 | $330,750 | $129,990 | $200,760 |
| 2015 | $21,851 | $330,750 | $129,990 | $200,760 |
| 2014 | $20,912 | $316,190 | $129,990 | $186,200 |
| 2013 | $10,462 | $301,140 | $123,795 | $177,345 |
Source: Public Records
Map
Nearby Homes
- 4499 Summit Ridge Rd
- 2560 Chartwell Rd
- 5000 Slate Run Woods Ct
- 2681 Lane Rd
- 5055 Slate Run Woods Ct
- 4861 Etrick Dr Unit 22
- 2248 Sandover Rd
- 2231 Atlee Ct Unit 12
- 2198 Sandston Rd
- 5227 Brynwood Dr
- 4390 Dublin Rd
- 2165 Partlow Dr
- 4781 Coach Rd
- 5322 Darlington Rd Unit E
- 5275 Brandy Oaks Ln
- 5277 Brandy Oaks Ln
- 5273 Brandy Oaks Ln
- 4450 Haverford Ct
- 2744 Greystone Dr Unit E
- 2060 Fontenay Place
- 0 Oldbridge Dr
- 4880 Oldbridge Dr
- 001 Oldbridge Dr
- 4930 Oldbridge Dr
- 4930 Oldbridge Dr
- 4949 Oldbridge Dr
- 2601 Slate Run Rd
- 2625 Slate Run Rd
- 2585 Slate Run Rd
- 4955 Oldbridge Dr
- 4899 Oldbridge Dr
- 4860 Oldbridge Dr
- 2555 Slate Run Rd
- 2610 Slate Run Rd
- 4965 Oldbridge Dr
- 2570 Clarion Ct
- 0 Old Bridge Dr
- 2600 Clarion Ct
- 2600 Slate Run Rd
- 2630 Clarion Ct