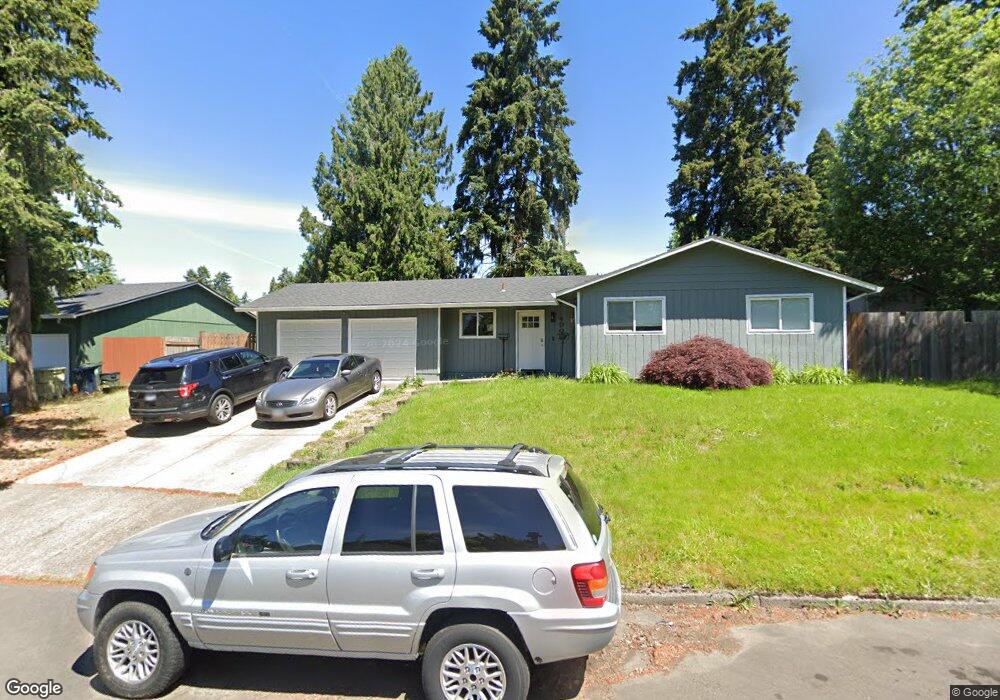
4900 SW 194th Ct Beaverton, OR 97007
Estimated Value: $423,000 - $458,000
3
Beds
1
Bath
945
Sq Ft
$467/Sq Ft
Est. Value
About This Home
This home is located at 4900 SW 194th Ct, Beaverton, OR 97007 and is currently estimated at $441,765, approximately $467 per square foot. 4900 SW 194th Ct is a home located in Washington County with nearby schools including Kinnaman Elementary School, Mountain View Middle School, and Aloha High School.
Ownership History
Date
Name
Owned For
Owner Type
Purchase Details
Closed on
Apr 27, 2022
Sold by
Zillow Homes Property Trust
Bought by
Fleming Tanner Lee and Fleming Amanda Christine
Current Estimated Value
Home Financials for this Owner
Home Financials are based on the most recent Mortgage that was taken out on this home.
Original Mortgage
$434,863
Outstanding Balance
$407,385
Interest Rate
4.16%
Mortgage Type
New Conventional
Estimated Equity
$34,380
Purchase Details
Closed on
Nov 1, 2021
Sold by
Alvarez Rebeca C
Bought by
Zillow Homes Porperty Trust
Purchase Details
Closed on
Jun 17, 2015
Sold by
Le Tu
Bought by
Alvarez Rebeca C
Home Financials for this Owner
Home Financials are based on the most recent Mortgage that was taken out on this home.
Original Mortgage
$230,055
Interest Rate
4.12%
Mortgage Type
FHA
Create a Home Valuation Report for This Property
The Home Valuation Report is an in-depth analysis detailing your home's value as well as a comparison with similar homes in the area
Home Values in the Area
Average Home Value in this Area
Purchase History
| Date | Buyer | Sale Price | Title Company |
|---|---|---|---|
| Fleming Tanner Lee | $457,750 | None Listed On Document | |
| Fleming Tanner Lee | $457,750 | None Listed On Document | |
| Zillow Homes Porperty Trust | $446,836 | Zillow Closing Services | |
| Zillow Homes Porperty Trust | $446,836 | Zillow Closing Services | |
| Alvarez Rebeca C | $234,300 | Stewart Title | |
| Alvarez Rebeca C | $234,300 | Stewart Title |
Source: Public Records
Mortgage History
| Date | Status | Borrower | Loan Amount |
|---|---|---|---|
| Open | Fleming Tanner Lee | $434,863 | |
| Previous Owner | Alvarez Rebeca C | $230,055 |
Source: Public Records
Tax History Compared to Growth
Tax History
| Year | Tax Paid | Tax Assessment Tax Assessment Total Assessment is a certain percentage of the fair market value that is determined by local assessors to be the total taxable value of land and additions on the property. | Land | Improvement |
|---|---|---|---|---|
| 2026 | $3,430 | $192,210 | -- | -- |
| 2025 | $3,430 | $186,620 | -- | -- |
| 2024 | $3,223 | $181,190 | -- | -- |
| 2023 | $3,223 | $175,920 | $0 | $0 |
| 2022 | $3,113 | $175,920 | $0 | $0 |
| 2021 | $3,001 | $165,830 | $0 | $0 |
| 2020 | $2,909 | $161,000 | $0 | $0 |
| 2019 | $2,819 | $156,320 | $0 | $0 |
| 2018 | $2,727 | $151,770 | $0 | $0 |
| 2017 | $2,630 | $147,350 | $0 | $0 |
| 2016 | $2,536 | $143,060 | $0 | $0 |
| 2015 | $2,458 | $138,900 | $0 | $0 |
| 2014 | $2,224 | $123,730 | $0 | $0 |
Source: Public Records
Map
Nearby Homes
- 19055 SW Butternut St
- 19560 SW Madeline St
- 19901 SW Meadowbrook Ct
- 18830 SW Butternut St
- 4650 SW Southview Terrace
- 19753 SW Celebrity St
- 4150 SW 191st Ave
- 19735 SW Rosa Rd
- 4895 SW 202nd Ave
- 5035 SW 184th Ave
- 5384 SW 186th Place
- 18985 SW Ellerson St
- 5826 SW Grayson Terrace
- 18695 SW Pike St
- 20020 SW Walquin Ct
- 4015 SW 185th Ave
- 18939 SW Hazelwood Ln Unit L-8
- 18902 SW Hazelwood Ln Unit L-13
- 18232 SW Orlov Ct
- 18989 SW Hazelwood Ln Unit L-2
- 4900 SW 194th Ct
- 4920 SW 194th Ct
- 4870 SW 194th Ct
- 4870 SW 194th Ct
- 19330 SW Anderson St
- 19360 SW Anderson St
- 19300 SW Anderson St
- 19300 SW Anderson St
- 4905 SW 194th Ct
- 19390 SW Anderson St
- 4940 SW 194th Ct
- 4885 SW 194th Ct
- 4925 SW 194th Ct
- 19270 SW Anderson St
- 4945 SW 194th Ct
- 4865 SW 194th Ct
- 19365 SW Anderson St
- 19395 SW Butternut St
- 19425 SW Butternut St
- 4875 SW 192nd Ave