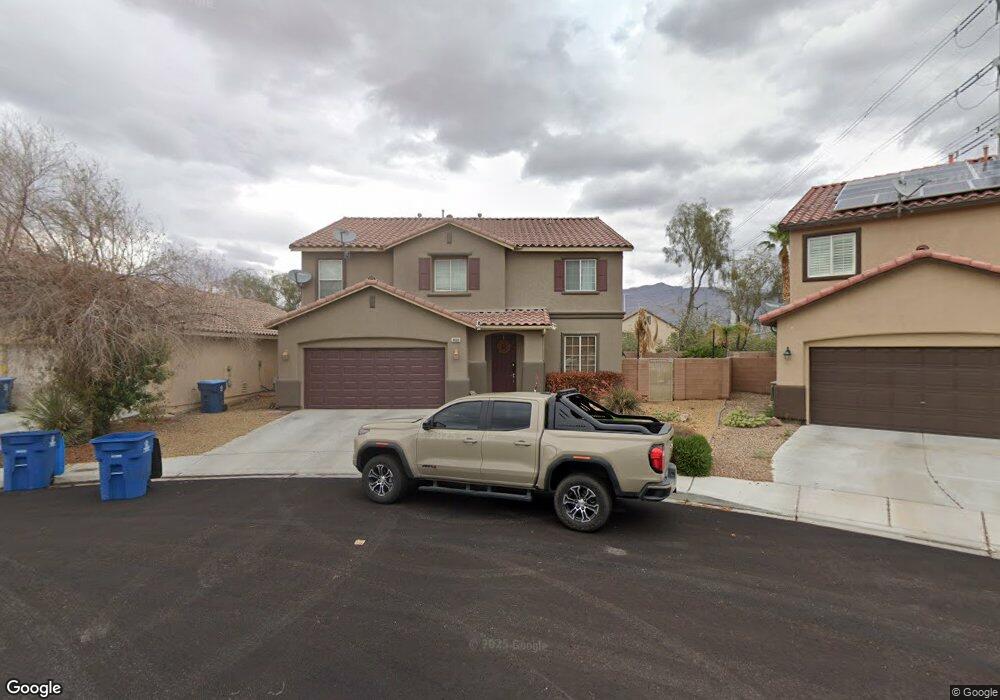
4900 Wild Buffalo Ave Unit 3 Las Vegas, NV 89131
Tule Springs NeighborhoodEstimated Value: $509,000 - $584,000
4
Beds
3
Baths
2,854
Sq Ft
$191/Sq Ft
Est. Value
About This Home
This home is located at 4900 Wild Buffalo Ave Unit 3, Las Vegas, NV 89131 and is currently estimated at $546,379, approximately $191 per square foot. 4900 Wild Buffalo Ave Unit 3 is a home located in Clark County with nearby schools including Howard E Heckethorn Elementary School, Anthony Saville Middle School, and Shadow Ridge High School.
Ownership History
Date
Name
Owned For
Owner Type
Purchase Details
Closed on
Jun 17, 2014
Sold by
Mullin Annette H and Darr Annette H
Bought by
Mullin Annette H
Current Estimated Value
Home Financials for this Owner
Home Financials are based on the most recent Mortgage that was taken out on this home.
Original Mortgage
$200,000
Outstanding Balance
$151,895
Interest Rate
4.16%
Mortgage Type
New Conventional
Estimated Equity
$394,484
Purchase Details
Closed on
Jan 23, 2014
Sold by
Darr Jason Paul
Bought by
Darr Annette Helen
Purchase Details
Closed on
Oct 22, 2002
Sold by
Kb Home Nevada Inc
Bought by
Mullin Annette H
Home Financials for this Owner
Home Financials are based on the most recent Mortgage that was taken out on this home.
Original Mortgage
$211,200
Interest Rate
6.09%
Create a Home Valuation Report for This Property
The Home Valuation Report is an in-depth analysis detailing your home's value as well as a comparison with similar homes in the area
Home Values in the Area
Average Home Value in this Area
Purchase History
| Date | Buyer | Sale Price | Title Company |
|---|---|---|---|
| Mullin Annette H | -- | National Title Co | |
| Darr Annette Helen | -- | None Available | |
| Mullin Annette H | $222,318 | First American Title Co |
Source: Public Records
Mortgage History
| Date | Status | Borrower | Loan Amount |
|---|---|---|---|
| Open | Mullin Annette H | $200,000 | |
| Closed | Mullin Annette H | $211,200 |
Source: Public Records
Tax History Compared to Growth
Tax History
| Year | Tax Paid | Tax Assessment Tax Assessment Total Assessment is a certain percentage of the fair market value that is determined by local assessors to be the total taxable value of land and additions on the property. | Land | Improvement |
|---|---|---|---|---|
| 2025 | $2,430 | $144,859 | $32,200 | $112,659 |
| 2024 | $2,360 | $144,859 | $32,200 | $112,659 |
| 2023 | $2,360 | $137,398 | $31,500 | $105,898 |
| 2022 | $2,291 | $125,572 | $28,700 | $96,872 |
| 2021 | $2,326 | $118,118 | $26,250 | $91,868 |
| 2020 | $2,157 | $113,091 | $22,050 | $91,041 |
| 2019 | $2,021 | $109,676 | $19,950 | $89,726 |
| 2018 | $1,929 | $102,458 | $16,800 | $85,658 |
| 2017 | $3,173 | $96,777 | $14,350 | $82,427 |
| 2016 | $1,806 | $84,976 | $11,550 | $73,426 |
| 2015 | $1,802 | $71,734 | $8,750 | $62,984 |
| 2014 | $1,749 | $51,773 | $8,750 | $43,023 |
Source: Public Records
Map
Nearby Homes
- 5033 Wild Buffalo Ave
- 4650 Aquarius Sky Ave Unit 331
- 4650 Aquarius Sky Ave Unit 332
- 7965 Pandora Sky St Unit 351
- 4640 Aquarius Sky Ave Unit 1
- 4640 Aquarius Sky Ave Unit 321
- 4640 Aquarius Sky Ave Unit 322
- 4640 Aquarius Sky Ave Unit 323
- 1349 Plan at Juno Pointe
- 1171 Plan at Juno Pointe
- 1600 Plan at Juno Pointe
- 7890 Aurora Sky St Unit 1
- 7825 Celestial Sky St Unit 2
- 7825 Celestial Sky St Unit 812
- 7880 Aurora Sky St Unit 3
- 7830 Celestial Sky St Unit 762
- 7830 Celestial Sky St Unit 763
- 4905 Apache Valley Ave Unit 2
- 8017 Pink Desert St
- 4908 Apache Valley Ave
- 7944 Pale Rider St
- 4908 Wild Buffalo Ave Unit 3
- 7940 Pale Rider St
- 4912 Wild Buffalo Ave Unit 3
- 7936 Pale Rider St
- 4903 Wild Buffalo Ave
- 4903 Wild Buffalo Ave Unit 102
- 4907 Wild Buffalo Ave
- 4916 Wild Buffalo Ave
- 7932 Pale Rider St
- 4911 Wild Buffalo Ave
- 8004 Carr Valley St
- 7928 Pale Rider St Unit 3
- 4915 Wild Buffalo Ave Unit 3
- 4927 Scholl Canyon Ave
- 4931 Scholl Canyon Ave
- 4900 Shady Rim Ct Unit 3
- 8008 Carr Valley St
- 4935 Scholl Canyon Ave
- 4904 Shady Rim Ct