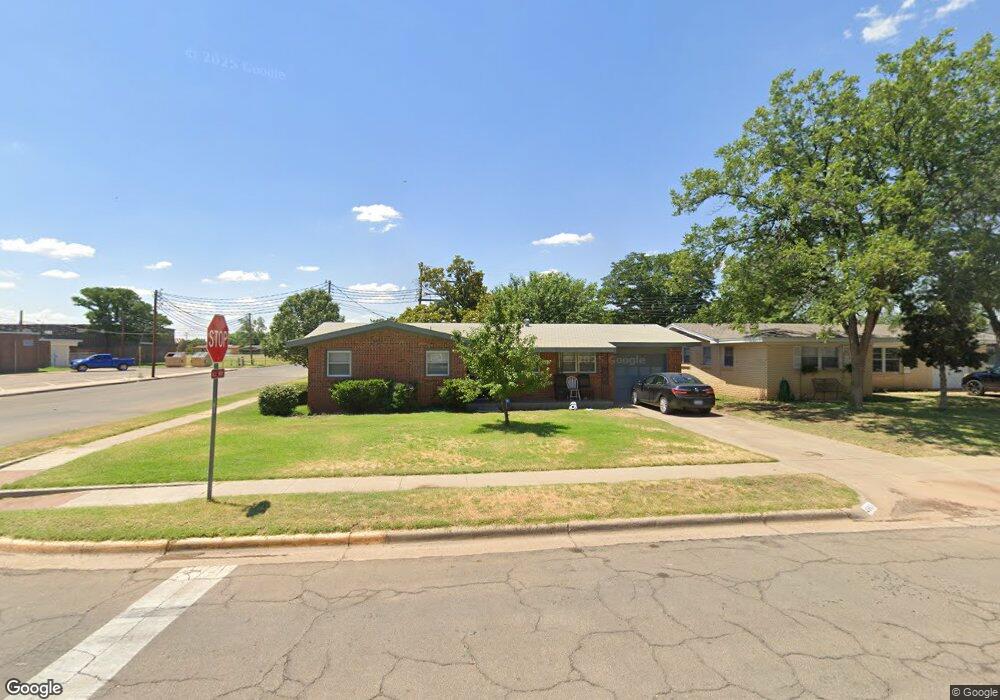
4901 46th St Lubbock, TX 79414
Stubbs-Stewart NeighborhoodEstimated Value: $144,000 - $162,000
3
Beds
2
Baths
1,394
Sq Ft
$111/Sq Ft
Est. Value
About This Home
This home is located at 4901 46th St, Lubbock, TX 79414 and is currently estimated at $155,152, approximately $111 per square foot. 4901 46th St is a home located in Lubbock County with nearby schools including Stewart Elementary School, Commander William C. McCool Academy, and Irons Middle School.
Ownership History
Date
Name
Owned For
Owner Type
Purchase Details
Closed on
Aug 17, 2023
Sold by
Dirks Thomas Henry
Bought by
Tom Dirks Trust and Dirks
Current Estimated Value
Purchase Details
Closed on
Jun 28, 2023
Sold by
Dirks Timothy Ludlow
Bought by
Tim Dirks Trust and Dirks
Purchase Details
Closed on
Nov 30, 2018
Sold by
Wordelman Rex Mitchel and Wordelman Marybeth
Bought by
Dirks Tim and Dirks Tom
Home Financials for this Owner
Home Financials are based on the most recent Mortgage that was taken out on this home.
Original Mortgage
$25,000
Interest Rate
4.8%
Mortgage Type
Purchase Money Mortgage
Purchase Details
Closed on
Aug 23, 2010
Sold by
Rex & Mary Beth Wordelman Trust
Bought by
Dirks Nathan and Dirks Nancy
Purchase Details
Closed on
Aug 17, 2010
Sold by
Kindred Kip and Kindred Billy H
Bought by
Rex Wordelman Trust and Mary Beth Wordelman Trust
Create a Home Valuation Report for This Property
The Home Valuation Report is an in-depth analysis detailing your home's value as well as a comparison with similar homes in the area
Home Values in the Area
Average Home Value in this Area
Purchase History
| Date | Buyer | Sale Price | Title Company |
|---|---|---|---|
| Tom Dirks Trust | -- | None Listed On Document | |
| Tim Dirks Trust | -- | None Listed On Document | |
| Dirks Tim | $25,000 | Hub City Title | |
| Dirks Jerika | -- | Hub City Title | |
| Dirks Nathan | $68,427 | None Available | |
| Rex Wordelman Trust | -- | None Available |
Source: Public Records
Mortgage History
| Date | Status | Borrower | Loan Amount |
|---|---|---|---|
| Previous Owner | Dirks Tim | $25,000 | |
| Closed | Dirks Nathan | $0 |
Source: Public Records
Tax History Compared to Growth
Tax History
| Year | Tax Paid | Tax Assessment Tax Assessment Total Assessment is a certain percentage of the fair market value that is determined by local assessors to be the total taxable value of land and additions on the property. | Land | Improvement |
|---|---|---|---|---|
| 2025 | $2,382 | $123,562 | $23,000 | $100,562 |
| 2024 | $2,382 | $131,159 | $11,055 | $120,104 |
| 2023 | $2,252 | $121,150 | $11,055 | $110,095 |
| 2022 | $2,425 | $119,815 | $11,055 | $108,760 |
| 2021 | $2,107 | $98,403 | $11,055 | $87,348 |
| 2020 | $2,140 | $98,403 | $11,055 | $87,348 |
| 2019 | $2,349 | $104,613 | $11,055 | $93,558 |
| 2018 | $2,271 | $101,014 | $11,055 | $89,959 |
| 2017 | $2,079 | $92,379 | $11,055 | $81,324 |
| 2016 | $2,066 | $91,785 | $11,055 | $80,730 |
| 2015 | $1,675 | $83,441 | $11,055 | $72,386 |
| 2014 | $1,675 | $83,680 | $5,025 | $78,655 |
Source: Public Records
Map
Nearby Homes