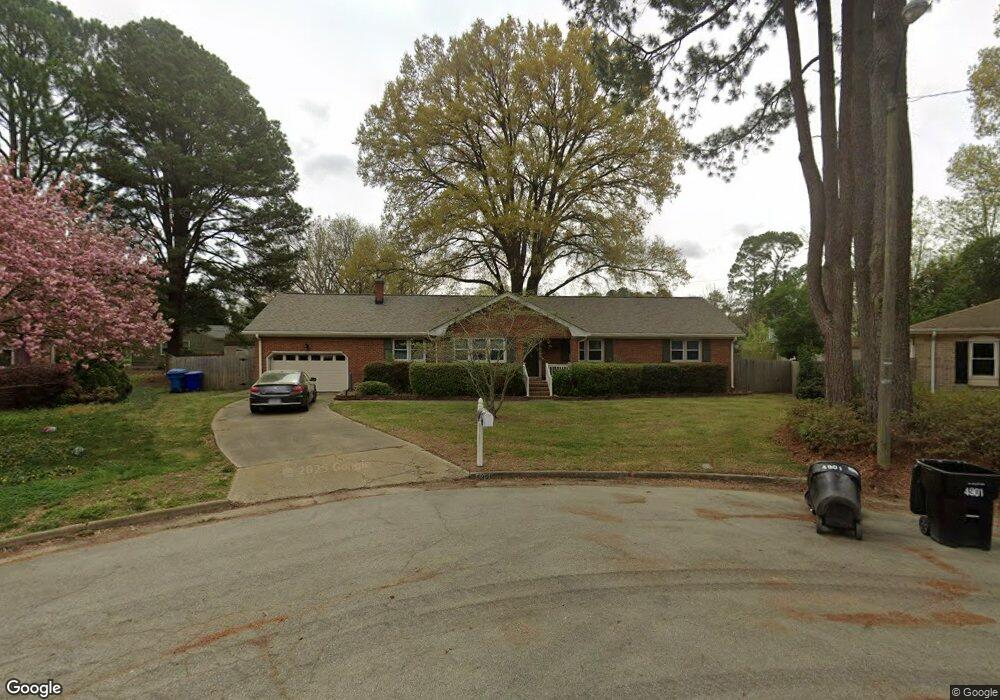
4901 Cresthaven Ct Virginia Beach, VA 23464
Estimated Value: $473,000 - $500,000
5
Beds
3
Baths
2,181
Sq Ft
$221/Sq Ft
Est. Value
About This Home
This home is located at 4901 Cresthaven Ct, Virginia Beach, VA 23464 and is currently estimated at $481,956, approximately $220 per square foot. 4901 Cresthaven Ct is a home located in Virginia Beach City with nearby schools including Kempsville Elementary School, Kempsville Middle School, and Kempsville High School.
Ownership History
Date
Name
Owned For
Owner Type
Purchase Details
Closed on
Nov 29, 2024
Sold by
Tillberg Stellmach Sharon and Tillberg Daniel Stellmach
Bought by
Tillberg Sharon Marie
Current Estimated Value
Home Financials for this Owner
Home Financials are based on the most recent Mortgage that was taken out on this home.
Original Mortgage
$161,910
Outstanding Balance
$157,598
Interest Rate
6.54%
Mortgage Type
New Conventional
Estimated Equity
$324,358
Purchase Details
Closed on
Apr 29, 2005
Sold by
Korahaes Lynette L
Bought by
Stellmach Sharon Tillberg
Home Financials for this Owner
Home Financials are based on the most recent Mortgage that was taken out on this home.
Original Mortgage
$160,405
Interest Rate
6.01%
Mortgage Type
New Conventional
Create a Home Valuation Report for This Property
The Home Valuation Report is an in-depth analysis detailing your home's value as well as a comparison with similar homes in the area
Home Values in the Area
Average Home Value in this Area
Purchase History
| Date | Buyer | Sale Price | Title Company |
|---|---|---|---|
| Tillberg Sharon Marie | -- | None Listed On Document | |
| Tillberg Sharon Marie | -- | None Listed On Document | |
| Stellmach Sharon Tillberg | $293,000 | -- |
Source: Public Records
Mortgage History
| Date | Status | Borrower | Loan Amount |
|---|---|---|---|
| Open | Tillberg Sharon Marie | $161,910 | |
| Closed | Tillberg Sharon Marie | $161,910 | |
| Previous Owner | Stellmach Sharon Tillberg | $160,405 |
Source: Public Records
Tax History Compared to Growth
Tax History
| Year | Tax Paid | Tax Assessment Tax Assessment Total Assessment is a certain percentage of the fair market value that is determined by local assessors to be the total taxable value of land and additions on the property. | Land | Improvement |
|---|---|---|---|---|
| 2025 | $3,558 | $391,400 | $165,000 | $226,400 |
| 2024 | $3,558 | $366,800 | $165,000 | $201,800 |
| 2023 | $3,532 | $356,800 | $155,000 | $201,800 |
| 2022 | $3,384 | $341,800 | $140,000 | $201,800 |
| 2021 | $2,918 | $294,700 | $120,000 | $174,700 |
| 2020 | $3,117 | $306,300 | $120,000 | $186,300 |
| 2019 | $2,979 | $274,600 | $110,000 | $164,600 |
| 2018 | $2,753 | $274,600 | $110,000 | $164,600 |
| 2017 | $2,576 | $257,000 | $99,000 | $158,000 |
| 2016 | $2,611 | $263,700 | $99,000 | $164,700 |
| 2015 | $2,655 | $268,200 | $103,500 | $164,700 |
| 2014 | $2,368 | $271,100 | $124,500 | $146,600 |
Source: Public Records
Map
Nearby Homes
- 5121 Lobaugh Dr
- 1053 Yardley Landing
- 5113 Stratford Chase Dr
- 700 Hemlock Crescent
- 1084 Willowbrooke Ct
- 4769 Marlborough Dr
- 1076 Burlington Rd
- 5097 Andover Rd
- 5417 Chatham Hall Dr
- 945 Lord Dunmore Dr
- 1216 Ferndale Ct
- 5241 Balboa Dr
- 4921 Ruth Rd
- 5008 Christian Cir
- 920 Hanover Dr
- 1220 Newmarket Dr
- 1108 Flobert Dr
- 5304 Gale Dr
- 5168 Edon Hall Ln
- 1104 Derken Ct
- 4900 Cresthaven Ct
- 1108 Cresthaven Ln
- 1108 Rollingwood Arch
- 5021 Providence Rd
- 5023 Providence Rd
- 1104 Rollingwood Arch
- 1112 Rollingwood Arch
- 1100 Cresthaven Ln
- 1112 Cresthaven Ln
- 1109 Cresthaven Ln
- 1113 Cresthaven Ln
- 1105 Cresthaven Ln
- 5013 Providence Rd
- 1116 Rollingwood Arch
- 1101 Cresthaven Ln
- 1105 Rollingwood Arch
- 1117 Cresthaven Ln
- 5020 Providence Rd
- 1109 Rollingwood Arch
- 1120 Cresthaven Ln