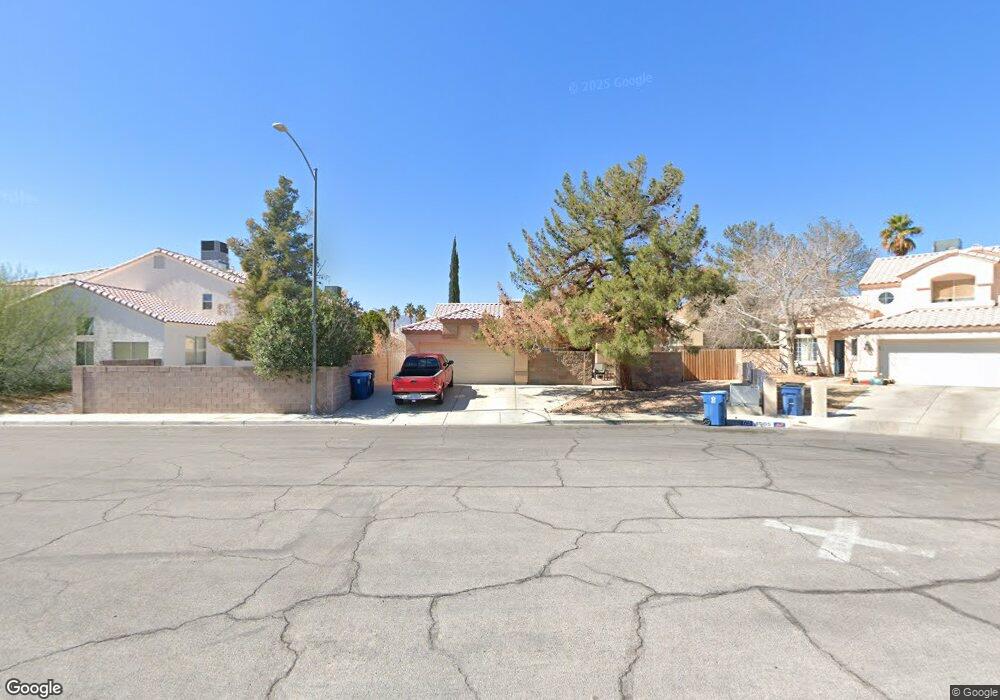
4901 Pulsar Ct Las Vegas, NV 89130
North Cheyenne NeighborhoodEstimated Value: $361,000 - $484,354
4
Beds
3
Baths
1,972
Sq Ft
$228/Sq Ft
Est. Value
About This Home
This home is located at 4901 Pulsar Ct, Las Vegas, NV 89130 and is currently estimated at $448,839, approximately $227 per square foot. 4901 Pulsar Ct is a home located in Clark County with nearby schools including Ernest May Elementary School, Theron L Swainston Middle School, and Shadow Ridge High School.
Ownership History
Date
Name
Owned For
Owner Type
Purchase Details
Closed on
May 13, 2024
Sold by
Mcclellan Paula
Bought by
Paula Norine Mcclellan Trust and Mcclellan
Current Estimated Value
Purchase Details
Closed on
Jan 6, 2003
Sold by
Winterboer Beverly N
Bought by
Mcclellan Paula
Home Financials for this Owner
Home Financials are based on the most recent Mortgage that was taken out on this home.
Original Mortgage
$89,050
Interest Rate
8%
Purchase Details
Closed on
May 30, 1995
Sold by
Vang Dennis E and Vang Heidi C
Bought by
Winterboer Arnold P and Winterboer Beverly N
Home Financials for this Owner
Home Financials are based on the most recent Mortgage that was taken out on this home.
Original Mortgage
$107,100
Interest Rate
8.32%
Create a Home Valuation Report for This Property
The Home Valuation Report is an in-depth analysis detailing your home's value as well as a comparison with similar homes in the area
Home Values in the Area
Average Home Value in this Area
Purchase History
| Date | Buyer | Sale Price | Title Company |
|---|---|---|---|
| Paula Norine Mcclellan Trust | -- | None Listed On Document | |
| Mcclellan Paula | $137,000 | Pioneer National Title | |
| Winterboer Arnold P | $119,000 | Nevada Title Company |
Source: Public Records
Mortgage History
| Date | Status | Borrower | Loan Amount |
|---|---|---|---|
| Previous Owner | Mcclellan Paula | $89,050 | |
| Previous Owner | Winterboer Arnold P | $107,100 |
Source: Public Records
Tax History Compared to Growth
Tax History
| Year | Tax Paid | Tax Assessment Tax Assessment Total Assessment is a certain percentage of the fair market value that is determined by local assessors to be the total taxable value of land and additions on the property. | Land | Improvement |
|---|---|---|---|---|
| 2025 | $1,985 | $107,493 | $32,550 | $74,943 |
| 2024 | $1,928 | $107,493 | $32,550 | $74,943 |
| 2023 | $1,928 | $101,723 | $30,450 | $71,273 |
| 2022 | $1,872 | $94,732 | $29,400 | $65,332 |
| 2021 | $1,818 | $91,702 | $29,400 | $62,302 |
| 2020 | $1,762 | $83,425 | $21,700 | $61,725 |
| 2019 | $1,710 | $81,585 | $20,650 | $60,935 |
| 2018 | $1,661 | $75,588 | $16,800 | $58,788 |
| 2017 | $1,573 | $76,473 | $16,800 | $59,673 |
| 2016 | $1,573 | $71,361 | $11,550 | $59,811 |
| 2015 | $1,570 | $54,866 | $8,750 | $46,116 |
| 2014 | $1,524 | $45,092 | $8,750 | $36,342 |
Source: Public Records
Map
Nearby Homes
- 5041 Peaceful Paradise St
- 6505 Quantum Ln
- 5059 Tranquil View St
- 5005 Chambliss Dr
- 6458 Secret Grove Ave
- 6507 Dove Point Place
- 6540 Angel Mountain Ave Unit 2
- 6406 Veranda Falls Ct
- 5144 Maverick St
- 6277 Kraft Ave
- 6225 Minerva Dr
- 6513 Echo Crest Ave
- 5116 Jordan Frey St Unit 201
- 6704 Indian Chief Dr Unit 101
- 5329 Bright Sun Ct
- 6701 Squaw Mountain Dr Unit 201
- 5364 Rhett St
- 6705 Squaw Mountain Dr Unit 102
- 6808 Indian Chief Dr Unit 204
- 6636 Painted Desert Dr
- 4905 Pulsar Ct
- 6500 Cosmo Ln
- 6500 Cosmo Ln Unit na
- 4900 Quasar Ct
- 6504 Cosmo Ln
- 4904 Quasar Ct
- 4908 Pulsar Ct
- 6508 Cosmo Ln
- 6424 Cosmo Ln
- 6421 Inwood Park Ct
- 4900 Pulsar Ct
- 6417 Inwood Park Ct
- 4904 Pulsar Ct
- 4908 Quasar Ct
- 6420 Cosmo Ln
- 6413 Inwood Park Ct
- 6501 Cosmo Ln
- 6505 Cosmo Ln
- 6516 Cosmo Ln
- 6429 Cosmo Ln