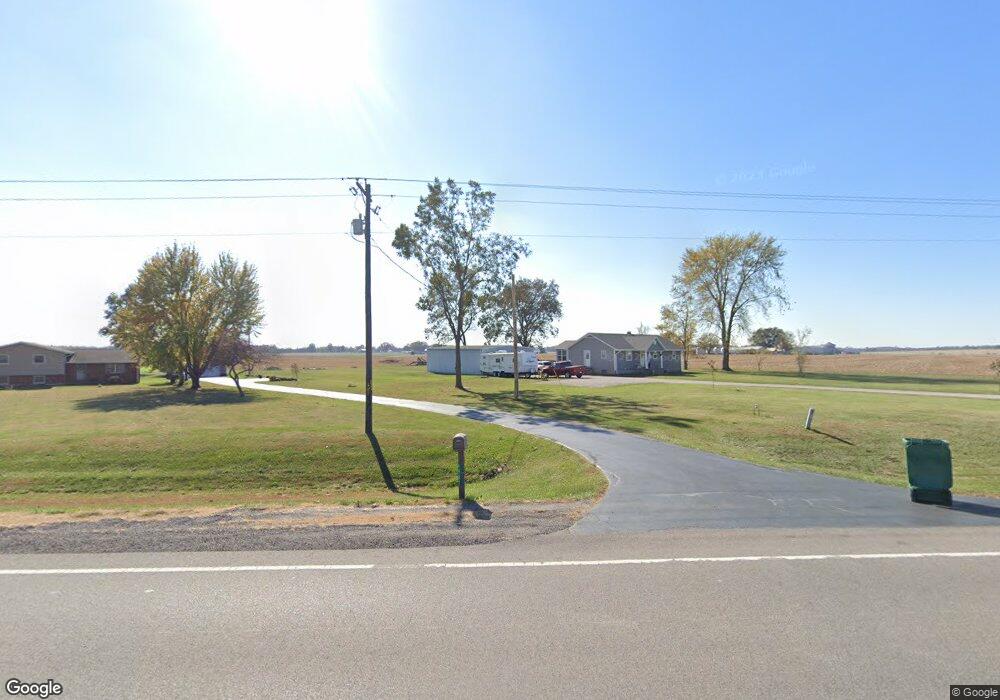
4901 State Route 15 Freeburg, IL 62243
Estimated Value: $139,979 - $329,000
--
Bed
--
Bath
1,196
Sq Ft
$216/Sq Ft
Est. Value
About This Home
This home is located at 4901 State Route 15, Freeburg, IL 62243 and is currently estimated at $258,745, approximately $216 per square foot. 4901 State Route 15 is a home located in St. Clair County with nearby schools including Freeburg Elementary School and Freeburg Community High School.
Ownership History
Date
Name
Owned For
Owner Type
Purchase Details
Closed on
Sep 13, 2010
Sold by
Flauaus Virginia and Wolf Charles J
Bought by
Travous Patrick and Travous Cathy
Current Estimated Value
Home Financials for this Owner
Home Financials are based on the most recent Mortgage that was taken out on this home.
Original Mortgage
$128,000
Outstanding Balance
$84,950
Interest Rate
4.54%
Mortgage Type
New Conventional
Estimated Equity
$173,795
Purchase Details
Closed on
Aug 27, 2010
Sold by
Flauaus Donald and Flauaus Virginia
Bought by
Flauaus Donald and Flauaus Virginia
Home Financials for this Owner
Home Financials are based on the most recent Mortgage that was taken out on this home.
Original Mortgage
$128,000
Outstanding Balance
$84,950
Interest Rate
4.54%
Mortgage Type
New Conventional
Estimated Equity
$173,795
Purchase Details
Closed on
Dec 21, 2005
Sold by
Wolf Virginia
Bought by
Wolf Charles J
Create a Home Valuation Report for This Property
The Home Valuation Report is an in-depth analysis detailing your home's value as well as a comparison with similar homes in the area
Home Values in the Area
Average Home Value in this Area
Purchase History
| Date | Buyer | Sale Price | Title Company |
|---|---|---|---|
| Travous Patrick | $160,000 | None Available | |
| Flauaus Donald | -- | None Available | |
| Wolf Charles J | -- | -- |
Source: Public Records
Mortgage History
| Date | Status | Borrower | Loan Amount |
|---|---|---|---|
| Open | Travous Patrick | $128,000 |
Source: Public Records
Tax History Compared to Growth
Tax History
| Year | Tax Paid | Tax Assessment Tax Assessment Total Assessment is a certain percentage of the fair market value that is determined by local assessors to be the total taxable value of land and additions on the property. | Land | Improvement |
|---|---|---|---|---|
| 2024 | $2,463 | $43,699 | $7,579 | $36,120 |
| 2023 | $2,230 | $39,773 | $4,576 | $35,197 |
| 2022 | $2,498 | $37,287 | $4,144 | $33,143 |
| 2021 | $2,394 | $35,364 | $3,870 | $31,494 |
| 2020 | $2,365 | $36,537 | $3,899 | $32,638 |
| 2019 | $2,272 | $33,860 | $3,781 | $30,079 |
| 2018 | $2,802 | $34,695 | $3,779 | $30,916 |
| 2017 | $2,710 | $33,807 | $3,614 | $30,193 |
| 2016 | $2,681 | $33,798 | $3,544 | $30,254 |
| 2014 | $2,653 | $36,442 | $3,597 | $32,845 |
| 2013 | $2,292 | $37,853 | $3,712 | $34,141 |
Source: Public Records
Map
Nearby Homes
- 0 Five Forks Rd
- 2309 S 6th St
- 2221 Pulliam Ave
- 2109 S 3rd St
- 2304 N 1st St
- 2201 Illinois Ave
- 5276 State Route 4
- tbb Illinois 15
- 109 Willow Dr
- 111 Willow Dr
- 0 Hickory Dr
- 103 Draco Dr
- 3 Park St
- 106 S Vine St
- 213 N Van Buren St
- 105 N Market St
- 207 N Edison St
- 401 N Edison St
- 402 S East St
- 520 N Edison St
- 4907 State Route 15
- 4919 State Route 15
- 4849 State Route 15
- 4936 State Route 15
- 15 State Route
- 4550 Lone Star Rd
- 5000 State Route 15
- 5005 State Route 15
- 4561 Lone Star Rd
- 4686 Lone Star Rd
- 4584 Lone Star Rd
- 4757 State Route 15
- 5039 State Route 15
- 4701 State Route 15
- 9405 Drum Hill Rd
- 4411 Lone Star Rd
- 4372 Lone Star Rd
- 9312 5 Forks Rd
- 0 5 Forks Rd
- 5087 State Route 15