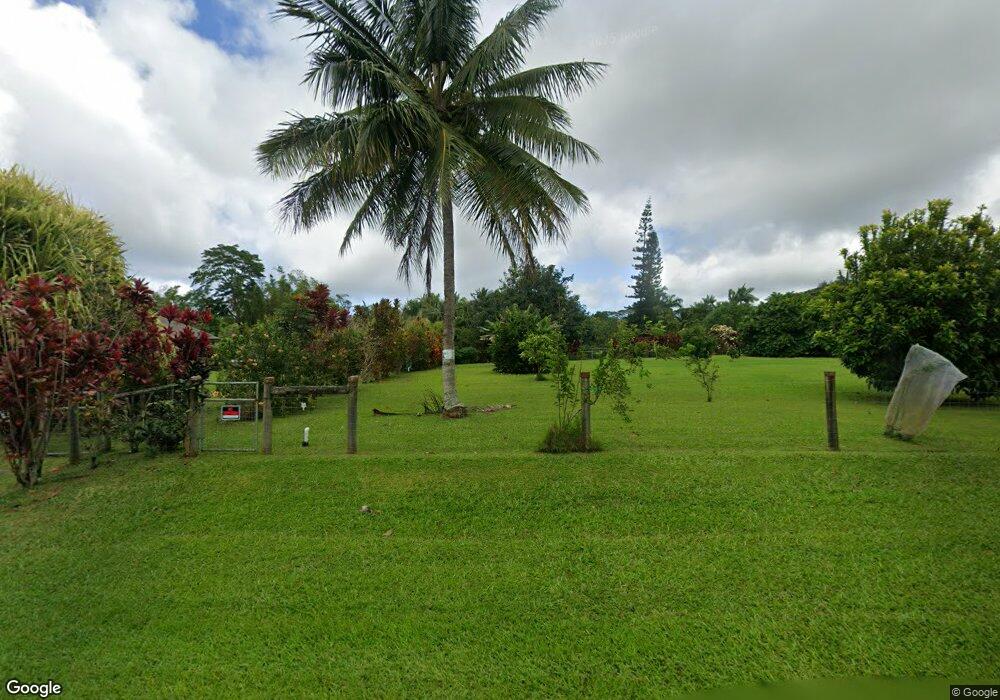
4901 Wailapa Rd Unit 1 Kilauea, HI 96754
Estimated Value: $1,799,000 - $2,803,000
2
Beds
2
Baths
105
Sq Ft
$20,992/Sq Ft
Est. Value
About This Home
This home is located at 4901 Wailapa Rd Unit 1, Kilauea, HI 96754 and is currently estimated at $2,204,155, approximately $20,991 per square foot. 4901 Wailapa Rd Unit 1 is a home located in Kauai County with nearby schools including Kilauea Elementary School, Kapa'a Middle School, and Kapa'a High School.
Ownership History
Date
Name
Owned For
Owner Type
Purchase Details
Closed on
May 31, 2016
Sold by
Fechner Joann K
Bought by
Fechner Joann K and Garland Jennifer Ruth
Current Estimated Value
Purchase Details
Closed on
Mar 18, 2016
Sold by
Lostrom Mark E and Lostrom Jane A
Bought by
Fechner Joann K
Purchase Details
Closed on
Jun 11, 2009
Sold by
Emens Richard W
Bought by
Lostrom Mark E and Lostrom Jane A
Home Financials for this Owner
Home Financials are based on the most recent Mortgage that was taken out on this home.
Original Mortgage
$250,000
Interest Rate
4.79%
Mortgage Type
Purchase Money Mortgage
Purchase Details
Closed on
Nov 28, 2000
Sold by
West Waiakalua Properties Llc
Bought by
Emens Richard W
Home Financials for this Owner
Home Financials are based on the most recent Mortgage that was taken out on this home.
Original Mortgage
$112,600
Interest Rate
7.86%
Mortgage Type
Purchase Money Mortgage
Create a Home Valuation Report for This Property
The Home Valuation Report is an in-depth analysis detailing your home's value as well as a comparison with similar homes in the area
Home Values in the Area
Average Home Value in this Area
Purchase History
| Date | Buyer | Sale Price | Title Company |
|---|---|---|---|
| Fechner Joann K | $1,000 | Accommodation | |
| Fechner Joann K | $930,000 | Tg | |
| Lostrom Mark E | $725,000 | Tg | |
| Emens Richard W | $187,600 | -- |
Source: Public Records
Mortgage History
| Date | Status | Borrower | Loan Amount |
|---|---|---|---|
| Previous Owner | Lostrom Mark E | $250,000 | |
| Previous Owner | Emens Richard W | $112,600 |
Source: Public Records
Tax History Compared to Growth
Tax History
| Year | Tax Paid | Tax Assessment Tax Assessment Total Assessment is a certain percentage of the fair market value that is determined by local assessors to be the total taxable value of land and additions on the property. | Land | Improvement |
|---|---|---|---|---|
| 2025 | $4,444 | $1,875,100 | $1,303,500 | $571,600 |
| 2024 | $4,444 | $1,909,400 | $1,303,500 | $605,900 |
| 2023 | $15,266 | $1,611,300 | $782,100 | $829,200 |
| 2022 | $7,809 | $1,270,900 | $0 | $0 |
| 2021 | $7,360 | $1,196,700 | $0 | $0 |
| 2020 | $7,353 | $1,195,600 | $619,200 | $576,400 |
| 2019 | $7,501 | $1,220,000 | $619,200 | $600,800 |
| 2018 | $6,961 | $1,130,800 | $619,200 | $511,600 |
| 2017 | $5,204 | $840,400 | $554,000 | $286,400 |
| 2016 | $1,453 | $436,900 | $436,900 | $0 |
| 2015 | $882 | $718,900 | $0 | $0 |
| 2014 | $3,870 | $655,400 | $0 | $0 |
Source: Public Records
Map
Nearby Homes
- 1636 Huli Rd
- 4675 Wailapa Rd Unit 4
- 4633 Waiakalua St Unit 1
- 4633 Waiakalua St Unit A
- 4417 Kahili Makai St Unit D
- 4469 N Waiakalua Rd Unit F
- 0 Kapuna Rd Unit 721531
- 0 Kapuna Rd Unit 712881
- 5-461 Kuhio Hwy Unit B
- 4228 N Waiakalua St Unit B & C
- 4228 N Waiakalua Rd Unit B & C
- 2471 Liliuokalani St
- 2444 Liliuokalani St
- 7465 Koolau Rd
- 7549-A Koolau Rd
- 4401 Aalona St
- 4095 Pali Moana Place
- 2332 Makana Ano Place
- 6820-B Koolau Rd
- 0 Kauapea Rd Unit 720036
- 4901 Wailapa Rd Unit A
- 4873 Wailapa Rd Unit B
- 4921 Wailapa Rd Unit 1
- 4921 Wailapa Rd Unit A
- 4911 Wailapa Rd Unit C
- 4863 Waiakalua St Unit 3
- 4910 Wailapa Rd Unit A
- 4929 Wailapa Rd Unit C
- 4843 Waiakalua St
- 4848C Wailapa Rd Unit 3
- 4910A Wailapa Rd Unit 1
- 4920 Wailapa Rd Unit C
- 4848 Wailapa Rd Unit C
- 4825 Wailapa Rd Unit B
- 4587 Waiakalua St
- 4910 Wailapa Rd Unit 2
- 4810 Waiakalua St
- 4840C Wailapa Rd Unit 2
- 4928 Wailapa Rd Unit 1
- 4985A Wailapa Rd Unit 1