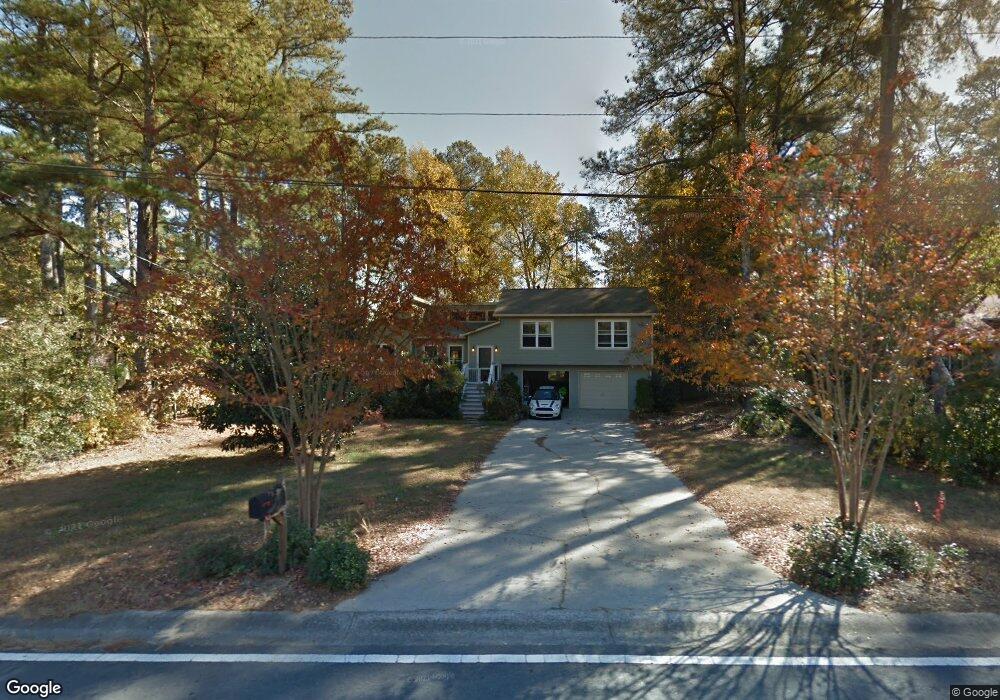
4902 Old Mtn Pk Rd NE Unit 1 Roswell, GA 30075
Sandy Plains NeighborhoodEstimated Value: $380,000 - $441,000
3
Beds
2
Baths
1,570
Sq Ft
$259/Sq Ft
Est. Value
About This Home
This home is located at 4902 Old Mtn Pk Rd NE Unit 1, Roswell, GA 30075 and is currently estimated at $406,346, approximately $258 per square foot. 4902 Old Mtn Pk Rd NE Unit 1 is a home located in Cobb County with nearby schools including Garrison Mill Elementary School, Mabry Middle School, and Lassiter High School.
Ownership History
Date
Name
Owned For
Owner Type
Purchase Details
Closed on
Nov 16, 2007
Sold by
Marshall Troy
Bought by
Nettles Kenneth W
Current Estimated Value
Home Financials for this Owner
Home Financials are based on the most recent Mortgage that was taken out on this home.
Original Mortgage
$113,050
Interest Rate
6.36%
Mortgage Type
New Conventional
Purchase Details
Closed on
Apr 5, 2004
Sold by
Parker Pamela D
Bought by
Marshall Troy
Home Financials for this Owner
Home Financials are based on the most recent Mortgage that was taken out on this home.
Original Mortgage
$162,500
Interest Rate
6.9%
Mortgage Type
New Conventional
Purchase Details
Closed on
Oct 17, 2000
Sold by
Sahara Inc
Bought by
Parker Pamela D
Home Financials for this Owner
Home Financials are based on the most recent Mortgage that was taken out on this home.
Original Mortgage
$134,888
Interest Rate
7.91%
Mortgage Type
FHA
Create a Home Valuation Report for This Property
The Home Valuation Report is an in-depth analysis detailing your home's value as well as a comparison with similar homes in the area
Home Values in the Area
Average Home Value in this Area
Purchase History
| Date | Buyer | Sale Price | Title Company |
|---|---|---|---|
| Nettles Kenneth W | $119,000 | -- | |
| Marshall Troy | $162,500 | -- | |
| Parker Pamela D | $136,000 | -- |
Source: Public Records
Mortgage History
| Date | Status | Borrower | Loan Amount |
|---|---|---|---|
| Closed | Nettles Kenneth W | $113,050 | |
| Previous Owner | Marshall Troy | $162,500 | |
| Previous Owner | Parker Pamela D | $134,888 |
Source: Public Records
Tax History Compared to Growth
Tax History
| Year | Tax Paid | Tax Assessment Tax Assessment Total Assessment is a certain percentage of the fair market value that is determined by local assessors to be the total taxable value of land and additions on the property. | Land | Improvement |
|---|---|---|---|---|
| 2025 | $3,843 | $164,848 | $36,000 | $128,848 |
| 2024 | $3,301 | $139,688 | $30,000 | $109,688 |
| 2023 | $2,758 | $139,688 | $30,000 | $109,688 |
| 2022 | $2,786 | $114,984 | $26,000 | $88,984 |
| 2021 | $2,638 | $108,208 | $24,000 | $84,208 |
| 2020 | $2,638 | $108,208 | $24,000 | $84,208 |
| 2019 | $2,132 | $85,084 | $18,000 | $67,084 |
| 2018 | $2,132 | $85,084 | $18,000 | $67,084 |
| 2017 | $2,103 | $87,596 | $18,000 | $69,596 |
| 2016 | $1,744 | $71,200 | $24,000 | $47,200 |
| 2015 | $1,787 | $71,200 | $24,000 | $47,200 |
| 2014 | $1,967 | $78,588 | $0 | $0 |
Source: Public Records
Map
Nearby Homes
- 4383 Capstone Ct NE
- 4973 Gunners Pass NE
- 2000 Trotters Ridge Way Unit 2B
- 4304 Lindsey Way NE
- 11790 Highland Colony Dr
- 1945 Ledieu Rd
- 11775 Highland Colony Dr Unit 1
- 1820 Azalea Springs Trail
- 11675 Highland Colony Dr Unit 1
- 235 Foxley Way
- 4765 Catoosa Trail NE Unit 2
- 5023 Gunners Run NE
- 123 Ivey Way
- 715 Winterwind Way
- 230 Moss Stone Way Unit 2
- 989 Wiley Bridge Rd
- 150 Flowing Spring Trail Unit 4
- 12180 Lonsdale Ln
- 4902 Old Mountain Park Rd NE
- 4912 Old Mountain Park Rd NE
- 4892 Old Mountain Park Rd NE
- 4882 Old Mountain Park Rd NE
- 4945 Surrey Dr
- 4399 Capstone Ct
- 4922 Old Mountain Park Rd NE
- 4955 Surrey Dr Unit 1
- 4925 Surrey Dr Unit 1
- 4395 Hollister Dr NE Unit 1
- 4931 Old Mountain Park Rd NE Unit 1
- 4931 Old Mountain Park Rd NE
- 4385 Hollister Dr NE Unit 1
- 4405 Hollister Dr NE
- 4941 Old Mountain Park Rd NE Unit 2
- 4941 Old Mountain Park Rd NE
- 4915 Surrey Dr Unit 1
- 4415 Hollister Dr NE Unit 1
- 4941 Old Mtn Pk Rd NE Unit 2
- 4951 Old Mtn Pk Rd NE Unit 3