Estimated Value: $1,346,457
Studio
--
Bath
1,608
Sq Ft
$837/Sq Ft
Est. Value
About This Home
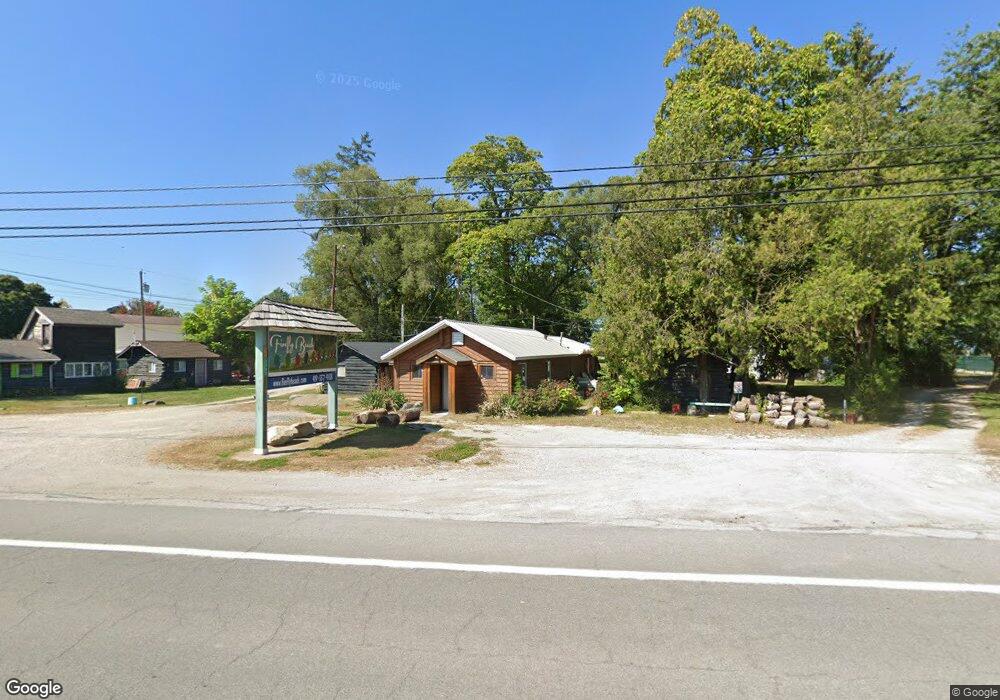
This home is located at 4903 Cleveland Rd E, Huron, OH 44839 and is currently estimated at $1,346,457, approximately $837 per square foot. 4903 Cleveland Rd E is a home located in Erie County with nearby schools including Vermilion Elementary School, Sailorway Middle School, and Vermilion High School.
Ownership History
Date
Name
Owned For
Owner Type
Purchase Details
Closed on
Feb 17, 2022
Sold by
Linea Llc
Bought by
Sand Stone Properties Llc
Current Estimated Value
Home Financials for this Owner
Home Financials are based on the most recent Mortgage that was taken out on this home.
Original Mortgage
$800,000
Outstanding Balance
$742,861
Interest Rate
3.55%
Mortgage Type
New Conventional
Estimated Equity
$603,596
Purchase Details
Closed on
Oct 8, 2008
Sold by
Schaffer Monna J
Bought by
Linea Llc
Home Financials for this Owner
Home Financials are based on the most recent Mortgage that was taken out on this home.
Original Mortgage
$400,000
Interest Rate
5.94%
Mortgage Type
Commercial
Create a Home Valuation Report for This Property
The Home Valuation Report is an in-depth analysis detailing your home's value as well as a comparison with similar homes in the area
Home Values in the Area
Average Home Value in this Area
Purchase History
| Date | Buyer | Sale Price | Title Company |
|---|---|---|---|
| Sand Stone Properties Llc | $1,071,160 | None Listed On Document | |
| Linea Llc | $1,250,000 | Lawyers Title Ins Corp |
Source: Public Records
Mortgage History
| Date | Status | Borrower | Loan Amount |
|---|---|---|---|
| Open | Sand Stone Properties Llc | $800,000 | |
| Previous Owner | Linea Llc | $400,000 |
Source: Public Records
Tax History
| Year | Tax Paid | Tax Assessment Tax Assessment Total Assessment is a certain percentage of the fair market value that is determined by local assessors to be the total taxable value of land and additions on the property. | Land | Improvement |
|---|---|---|---|---|
| 2024 | $25,306 | $434,077 | $347,200 | $86,877 |
| 2023 | $25,290 | $374,906 | $260,400 | $114,506 |
| 2022 | $25,487 | $374,906 | $260,400 | $114,506 |
| 2021 | $25,367 | $374,910 | $260,400 | $114,510 |
| 2020 | $25,136 | $366,710 | $260,400 | $106,310 |
| 2019 | $26,001 | $366,710 | $260,400 | $106,310 |
| 2018 | $25,960 | $366,710 | $260,400 | $106,310 |
| 2017 | $27,508 | $374,260 | $260,400 | $113,860 |
| 2016 | $29,234 | $387,190 | $260,400 | $126,790 |
| 2015 | $28,950 | $400,150 | $260,400 | $139,750 |
| 2014 | $31,464 | $426,820 | $210,270 | $216,550 |
| 2013 | $31,265 | $426,820 | $210,270 | $216,550 |
Source: Public Records
Map
Nearby Homes
- 5605 W Lake Rd Unit 155
- 5605 W Lake Rd Unit 20
- 5605 W Lake Rd Unit 9
- 5605 W Lake Rd Unit 8
- 5605 W Lake Rd Unit 154
- 5605 W Lake Rd Unit 146
- 5605 W Lake Rd Unit 23
- 5605 W Lake Rd Unit 25
- 5605 W Lake Rd Unit 4
- 5605 W Lake Rd Unit 7
- 5605 W Lake Rd Unit 24
- 5605 W Lake Rd Unit 22
- 5605 W Lake Rd Unit 126
- 5605 W Lake Rd Unit 3
- 5605 W Lake Rd Unit 11
- 5605 W Lake Rd Unit 114
- 5605 W Lake Rd Unit 151
- 5605 W Lake Rd Unit 122
- 5605 W Lake Rd Unit 2
- 5605 W Lake Rd Unit 10
Your Personal Tour Guide
Ask me questions while you tour the home.