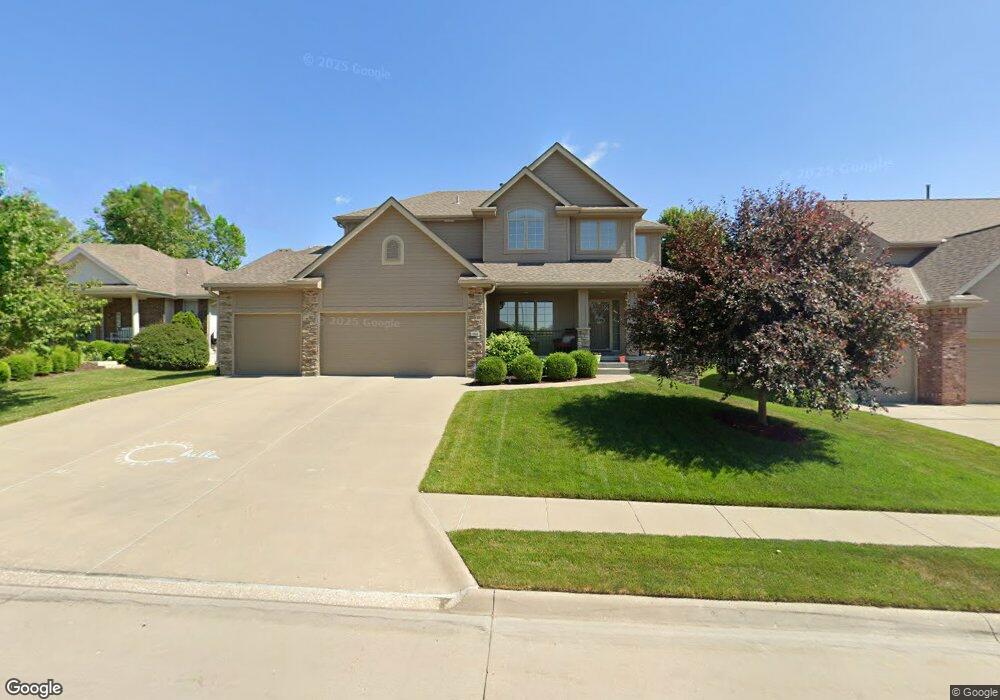
4903 Coffey St Papillion, NE 68133
Estimated Value: $431,556 - $559,000
4
Beds
3
Baths
2,468
Sq Ft
$199/Sq Ft
Est. Value
About This Home
This home is located at 4903 Coffey St, Papillion, NE 68133 and is currently estimated at $490,889, approximately $198 per square foot. 4903 Coffey St is a home located in Sarpy County with nearby schools including Bellevue Elementary School, Lewis & Clark Middle School, and Bellevue West High School.
Ownership History
Date
Name
Owned For
Owner Type
Purchase Details
Closed on
Feb 2, 2009
Sold by
Hoovestol Wayne and Hoovestol Monica A
Bought by
Smoots William R and Smoots Carrie J
Current Estimated Value
Home Financials for this Owner
Home Financials are based on the most recent Mortgage that was taken out on this home.
Original Mortgage
$110,000
Outstanding Balance
$27,619
Interest Rate
5.17%
Estimated Equity
$463,270
Purchase Details
Closed on
Aug 31, 2007
Sold by
Wilson Brian A and Lee Wilson Jennifer H
Bought by
Hoovestol Wayne
Home Financials for this Owner
Home Financials are based on the most recent Mortgage that was taken out on this home.
Original Mortgage
$215,925
Interest Rate
6.72%
Purchase Details
Closed on
May 6, 2005
Sold by
Dodge Lots Joint Venture
Bought by
Wilson Brian A
Create a Home Valuation Report for This Property
The Home Valuation Report is an in-depth analysis detailing your home's value as well as a comparison with similar homes in the area
Home Values in the Area
Average Home Value in this Area
Purchase History
| Date | Buyer | Sale Price | Title Company |
|---|---|---|---|
| Smoots William R | $270,000 | Nlta | |
| Hoovestol Wayne | $288,000 | Nlta | |
| Wilson Brian A | $32,000 | -- |
Source: Public Records
Mortgage History
| Date | Status | Borrower | Loan Amount |
|---|---|---|---|
| Open | Smoots William R | $110,000 | |
| Previous Owner | Hoovestol Wayne | $215,925 |
Source: Public Records
Tax History Compared to Growth
Tax History
| Year | Tax Paid | Tax Assessment Tax Assessment Total Assessment is a certain percentage of the fair market value that is determined by local assessors to be the total taxable value of land and additions on the property. | Land | Improvement |
|---|---|---|---|---|
| 2025 | $7,107 | $426,876 | $58,000 | $368,876 |
| 2024 | $8,009 | $408,167 | $58,000 | $350,167 |
| 2023 | $8,009 | $379,265 | $53,000 | $326,265 |
| 2022 | $7,472 | $347,186 | $50,000 | $297,186 |
| 2021 | $7,123 | $325,399 | $50,000 | $275,399 |
| 2020 | $7,076 | $321,936 | $42,000 | $279,936 |
| 2019 | $7,236 | $320,754 | $38,000 | $282,754 |
| 2018 | $6,757 | $302,113 | $38,000 | $264,113 |
| 2017 | $6,630 | $287,969 | $38,000 | $249,969 |
| 2016 | $6,580 | $286,754 | $36,000 | $250,754 |
| 2015 | $6,390 | $278,832 | $36,000 | $242,832 |
| 2014 | $6,618 | $276,840 | $36,000 | $240,840 |
| 2012 | -- | $276,474 | $36,000 | $240,474 |
Source: Public Records
Map
Nearby Homes
- 11903 S 49th St
- 4724 Coffey St
- 4714 Coffey St
- 5004 Westlake Cir
- 11828 S 52nd St
- 5008 Westlake Cir
- 4614 Windcrest Dr
- 5114 Timberridge Dr
- 4556 Barksdale Dr
- 4552 Barksdale Dr
- 4557 Barksdale Dr
- 4510 Barksdale Dr
- 4406 Barksdale Dr
- 12039 S 45th Ave
- 12017 Daniell Rd
- 4918 Fountain Dr
- 4407 Amos Gates Dr
- 4917 Shannon Dr
- 12029 Daniell Rd
- 12033 Daniell Rd
- 4817 Coffey St
- 4907 Coffey St
- 4816 Sierra St
- 4813 Coffey St
- 4820 Sierra St
- 4911 Coffey St
- 4806 Sierra St
- 4906 Sierra St
- 4906 Coffey St
- 4809 Coffey St
- 4818 Coffey St
- 4910 Coffey St
- 5005 Coffey St
- 4910 Sierra St
- 4804 Sierra St
- 4814 Coffey St
- 5006 Coffey St
- 11839 S 49th St
- 4810 Coffey St
- 4805 Coffey St