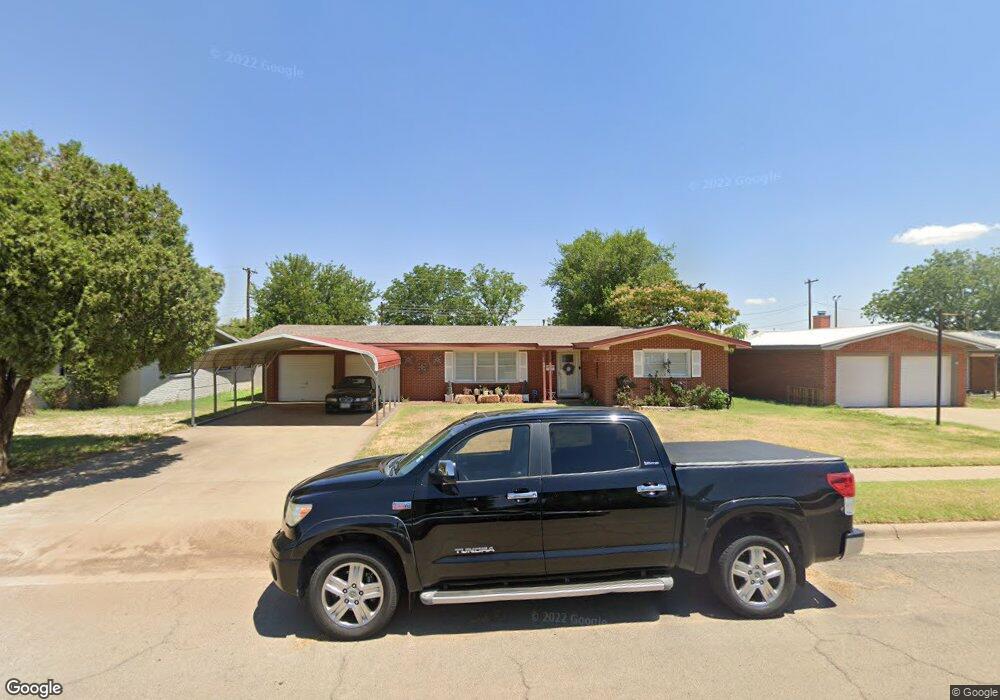
4904 49th St Lubbock, TX 79414
Stubbs-Stewart NeighborhoodEstimated Value: $169,000 - $184,989
4
Beds
2
Baths
1,591
Sq Ft
$111/Sq Ft
Est. Value
About This Home
This home is located at 4904 49th St, Lubbock, TX 79414 and is currently estimated at $176,747, approximately $111 per square foot. 4904 49th St is a home located in Lubbock County with nearby schools including Stewart Elementary School, Commander William C. McCool Academy, and Irons Middle School.
Ownership History
Date
Name
Owned For
Owner Type
Purchase Details
Closed on
Jan 26, 2024
Sold by
Garza Kathy A
Bought by
Gutierrez Jose
Current Estimated Value
Home Financials for this Owner
Home Financials are based on the most recent Mortgage that was taken out on this home.
Original Mortgage
$175,610
Outstanding Balance
$172,537
Interest Rate
6.95%
Mortgage Type
VA
Estimated Equity
$4,210
Purchase Details
Closed on
Aug 20, 2010
Sold by
Smith Danny D and Smith Dessa M
Bought by
Garza Kathy A
Home Financials for this Owner
Home Financials are based on the most recent Mortgage that was taken out on this home.
Original Mortgage
$91,935
Interest Rate
4.54%
Mortgage Type
VA
Purchase Details
Closed on
Oct 29, 1993
Bought by
Garza Kathy A
Create a Home Valuation Report for This Property
The Home Valuation Report is an in-depth analysis detailing your home's value as well as a comparison with similar homes in the area
Home Values in the Area
Average Home Value in this Area
Purchase History
| Date | Buyer | Sale Price | Title Company |
|---|---|---|---|
| Gutierrez Jose | -- | Service Title | |
| Garza Kathy A | $90,000 | Service Title Company | |
| Garza Kathy A | -- | -- |
Source: Public Records
Mortgage History
| Date | Status | Borrower | Loan Amount |
|---|---|---|---|
| Open | Gutierrez Jose | $175,610 | |
| Previous Owner | Garza Kathy A | $91,935 |
Source: Public Records
Tax History Compared to Growth
Tax History
| Year | Tax Paid | Tax Assessment Tax Assessment Total Assessment is a certain percentage of the fair market value that is determined by local assessors to be the total taxable value of land and additions on the property. | Land | Improvement |
|---|---|---|---|---|
| 2025 | $2,161 | $169,139 | $23,000 | $146,139 |
| 2024 | $2,161 | $180,998 | $12,375 | $168,623 |
| 2023 | $1,956 | $166,946 | $12,375 | $154,571 |
| 2022 | $3,196 | $157,879 | $12,375 | $152,697 |
| 2021 | $3,074 | $143,526 | $12,375 | $131,151 |
| 2020 | $2,936 | $135,010 | $12,375 | $122,635 |
| 2019 | $2,763 | $123,087 | $12,375 | $110,712 |
| 2018 | $2,671 | $118,829 | $12,375 | $106,454 |
| 2017 | $2,445 | $108,609 | $12,375 | $96,234 |
| 2016 | $2,415 | $107,309 | $12,375 | $94,934 |
| 2015 | $1,731 | $97,554 | $12,375 | $85,179 |
| 2014 | $1,731 | $98,182 | $5,625 | $92,557 |
Source: Public Records
Map
Nearby Homes