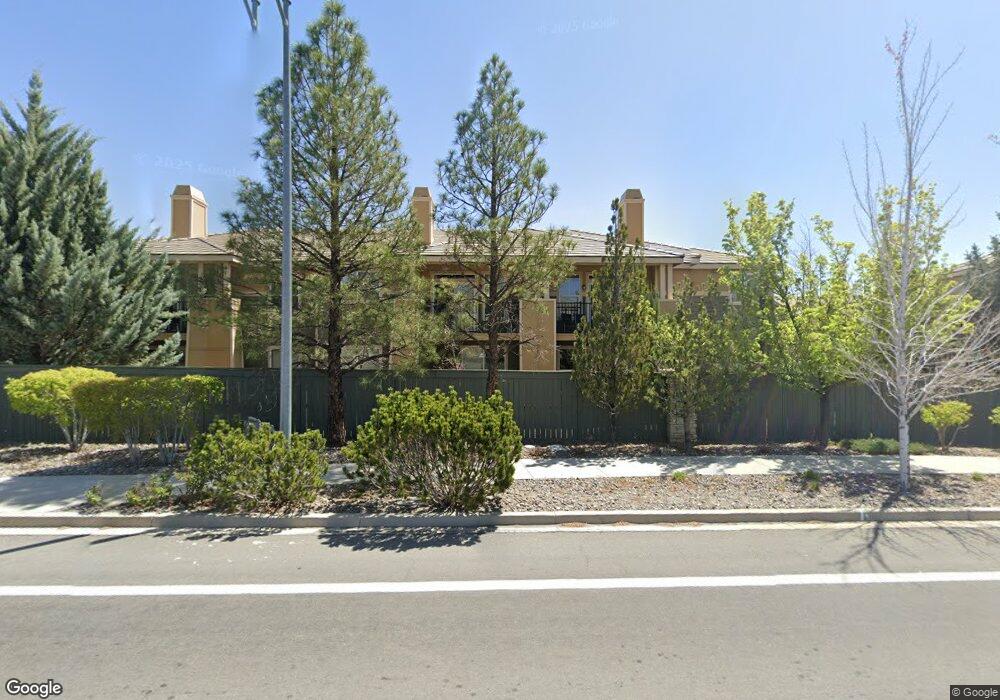
4904 Bougainvillea Dr Unit 23/1E Sparks, NV 89436
Sparks Galleria NeighborhoodEstimated Value: $415,000 - $430,077
3
Beds
2
Baths
1,748
Sq Ft
$241/Sq Ft
Est. Value
About This Home
This home is located at 4904 Bougainvillea Dr Unit 23/1E, Sparks, NV 89436 and is currently estimated at $422,019, approximately $241 per square foot. 4904 Bougainvillea Dr Unit 23/1E is a home located in Washoe County with nearby schools including Miguel Sepulveda Elementary School, Sky Ranch Middle School, and Edward C Reed High School.
Ownership History
Date
Name
Owned For
Owner Type
Purchase Details
Closed on
Sep 29, 2014
Sold by
Serafico Andrew M and Guijaro Geralyn E
Bought by
Asilo Carmelo A and Asilo Marcia D
Current Estimated Value
Home Financials for this Owner
Home Financials are based on the most recent Mortgage that was taken out on this home.
Original Mortgage
$181,649
Outstanding Balance
$140,781
Interest Rate
4.4%
Mortgage Type
FHA
Estimated Equity
$281,238
Purchase Details
Closed on
Sep 27, 2006
Sold by
Galleria Station Llc
Bought by
Serafico Andrew M and Guijaro Geralyn E
Home Financials for this Owner
Home Financials are based on the most recent Mortgage that was taken out on this home.
Original Mortgage
$258,795
Interest Rate
6.53%
Mortgage Type
Unknown
Create a Home Valuation Report for This Property
The Home Valuation Report is an in-depth analysis detailing your home's value as well as a comparison with similar homes in the area
Home Values in the Area
Average Home Value in this Area
Purchase History
| Date | Buyer | Sale Price | Title Company |
|---|---|---|---|
| Asilo Carmelo A | $185,000 | Western Title Co | |
| Serafico Andrew M | -- | Western Title Co | |
| Guijaro Geralyn E | -- | Western Title Company Inc | |
| Serafico Andrew M | $323,500 | Ticor Title Of Nevada Inc |
Source: Public Records
Mortgage History
| Date | Status | Borrower | Loan Amount |
|---|---|---|---|
| Open | Asilo Carmelo A | $181,649 | |
| Previous Owner | Serafico Andrew M | $258,795 |
Source: Public Records
Tax History Compared to Growth
Tax History
| Year | Tax Paid | Tax Assessment Tax Assessment Total Assessment is a certain percentage of the fair market value that is determined by local assessors to be the total taxable value of land and additions on the property. | Land | Improvement |
|---|---|---|---|---|
| 2025 | $2,027 | $97,208 | $28,665 | $68,543 |
| 2024 | $2,027 | $96,283 | $25,480 | $70,803 |
| 2023 | $1,969 | $92,148 | $29,645 | $62,503 |
| 2022 | $1,912 | $77,119 | $23,275 | $53,844 |
| 2021 | $1,857 | $72,770 | $18,900 | $53,870 |
| 2020 | $1,800 | $74,025 | $19,775 | $54,250 |
| 2019 | $1,748 | $71,177 | $18,690 | $52,487 |
| 2018 | $1,697 | $63,688 | $12,390 | $51,298 |
| 2017 | $1,648 | $63,166 | $12,285 | $50,881 |
| 2016 | $1,605 | $62,354 | $10,710 | $51,644 |
| 2015 | $1,600 | $55,879 | $7,560 | $48,319 |
| 2014 | $1,555 | $42,613 | $6,090 | $36,523 |
| 2013 | -- | $41,676 | $5,950 | $35,726 |
Source: Public Records
Map
Nearby Homes
- 4823 Tree Swallow Ln
- 4956 Monrovia Dr
- 4794 Sage Thrasher Way
- 4739 Wood Thrush Ln
- 4750 Desert Song Ct
- 4719 Wood Thrush Ln
- 519 N Sand Crane Cir
- 6550 Pyramid Way Unit 61
- 510 S Sand Crane Cir
- 6671 April St
- 801 Pinchot Pass Ct Unit 7
- 811 Pinchot Pass Ct Unit 5
- 4950 San Diego Ct
- 6835 Summit View Dr
- 5365 Ebbetts Pass Dr
- 5049 Keams Ct
- 6690 Dorchester Dr
- 6835 Pah Rah Dr
- 6515 Jamon Dr
- 6560 Pyramid Way Unit 52
- 4904 Bougainvillea Dr Unit 23E
- 4900 Bougainvillea Cir
- 4900 Bougainvillea Dr Unit 23B
- 4900 Bougainvillea Dr Unit B
- 4908 Bougainvillea Dr Unit 23D
- 4908 Bougainvillea Dr
- 4916 Bougainvillea Dr Unit 23A
- 4916 Bougainvillea Dr
- 4916 Bougainvillea Cir
- 4912 Bougainvillea Dr Unit 23C
- 4912 Bougainvillea Dr
- 4912 Bougainvillea Dr
- 4892 Bougainvillea Dr Unit 22C
- 4892 Bougainvillea Dr Unit 22/2C
- 4896 Bougainvillea Dr Unit 22A
- 4896 Bougainvillea Dr
- 4881 Pescadero Dr Unit 18A
- 4881 Pescadero Dr Unit 18/1A
- 4897 Pescadero Dr Unit 18B
- 4897 Pescadero Dr Unit 18/1B