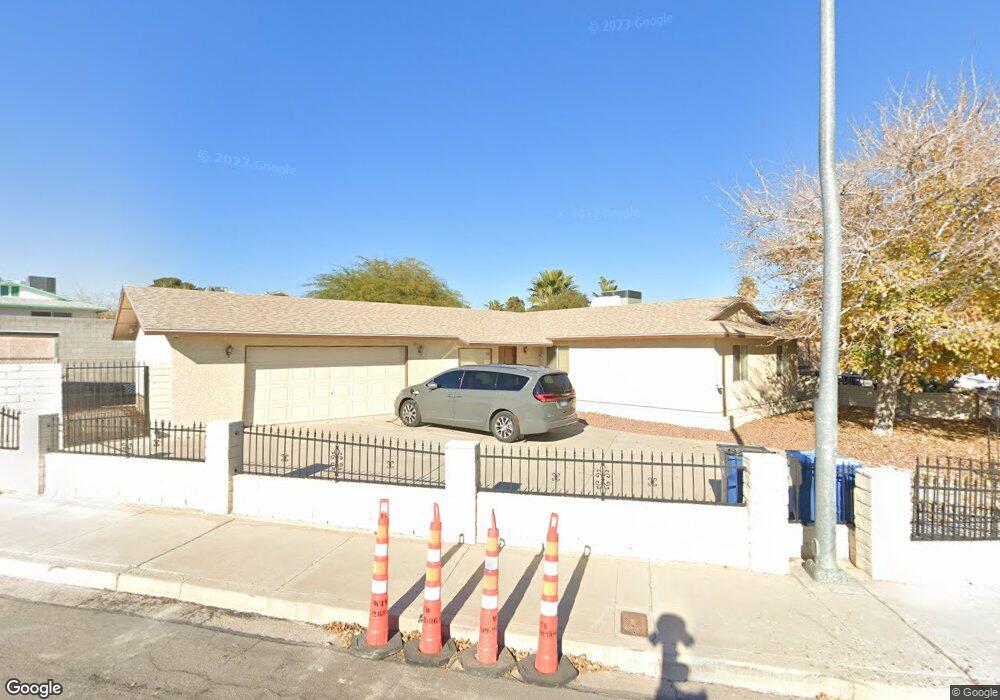
4906 Elaina Ave Las Vegas, NV 89120
Paradise Valley East NeighborhoodEstimated Value: $343,000 - $382,000
3
Beds
2
Baths
1,371
Sq Ft
$266/Sq Ft
Est. Value
About This Home
This home is located at 4906 Elaina Ave, Las Vegas, NV 89120 and is currently estimated at $364,522, approximately $265 per square foot. 4906 Elaina Ave is a home located in Clark County with nearby schools including Harley Harmon Elementary School, Francis H Cortney Junior High School, and Del Sol Academy of the Performing Arts.
Ownership History
Date
Name
Owned For
Owner Type
Purchase Details
Closed on
Jul 3, 2008
Sold by
Bank Of New York
Bought by
Pratt Robert G and Pratt Malina W
Current Estimated Value
Home Financials for this Owner
Home Financials are based on the most recent Mortgage that was taken out on this home.
Original Mortgage
$122,084
Interest Rate
6.59%
Mortgage Type
FHA
Purchase Details
Closed on
Mar 15, 2008
Sold by
Kirk Latisa
Bought by
Bank Of New York and Certificateholders Cwalt Inc Alternative
Purchase Details
Closed on
Dec 12, 2005
Sold by
Norman John F
Bought by
Kirk Latisa
Home Financials for this Owner
Home Financials are based on the most recent Mortgage that was taken out on this home.
Original Mortgage
$198,400
Interest Rate
7.68%
Mortgage Type
Unknown
Create a Home Valuation Report for This Property
The Home Valuation Report is an in-depth analysis detailing your home's value as well as a comparison with similar homes in the area
Home Values in the Area
Average Home Value in this Area
Purchase History
| Date | Buyer | Sale Price | Title Company |
|---|---|---|---|
| Pratt Robert G | $124,000 | First American Title Paseo V | |
| Bank Of New York | $184,500 | Fidelity National Title | |
| Kirk Latisa | $248,000 | Equity Title Of Nevada |
Source: Public Records
Mortgage History
| Date | Status | Borrower | Loan Amount |
|---|---|---|---|
| Previous Owner | Pratt Robert G | $122,084 | |
| Previous Owner | Kirk Latisa | $198,400 |
Source: Public Records
Tax History Compared to Growth
Tax History
| Year | Tax Paid | Tax Assessment Tax Assessment Total Assessment is a certain percentage of the fair market value that is determined by local assessors to be the total taxable value of land and additions on the property. | Land | Improvement |
|---|---|---|---|---|
| 2025 | $676 | $47,503 | $26,950 | $20,553 |
| 2024 | $657 | $47,503 | $26,950 | $20,553 |
| 2023 | $535 | $48,934 | $30,450 | $18,484 |
| 2022 | $638 | $42,370 | $24,850 | $17,520 |
| 2021 | $619 | $40,339 | $23,100 | $17,239 |
| 2020 | $598 | $36,915 | $19,250 | $17,665 |
| 2019 | $581 | $34,358 | $16,450 | $17,908 |
| 2018 | $564 | $32,997 | $15,400 | $17,597 |
| 2017 | $946 | $32,249 | $14,000 | $18,249 |
| 2016 | $535 | $28,631 | $9,450 | $19,181 |
| 2015 | $533 | $27,060 | $7,700 | $19,360 |
| 2014 | $518 | $24,823 | $5,250 | $19,573 |
Source: Public Records
Map
Nearby Homes
- 4999 Nellis Cir
- 5030 E Hacienda Ave
- 5225 Saratoga Dr
- 4915 E Russell Rd
- 5155 Saratoga Dr
- 5251 Tipper Ave
- 5383 Mountain Vista St Unit 31
- 4674 Petaluma Cir
- 5289 Chattanooga Ave
- 5022 Carmel Ave Unit 3
- 5142 Morris St
- 5284 Wellesley Ave
- 5086 Mountain Vista St
- 5068 Killarney St
- 4676 Tamalpias Ave
- 4465 Emerald Ave
- 5359 Chattanooga Ave
- 4715 Mill Valley Dr
- 5570 Palm St
- 4805 Terra Linda Ave
- 4912 Elaina Ave
- 5446 Elaina Cir
- 5454 Elaina Cir
- 5438 Elaina Cir
- 4918 Elaina Ave
- 4907 Elaina Ave
- 4899 Elaina Ave
- 4913 Elaina Ave
- 4893 Elaina Ave
- 4893 Elaina Ave Unit n/a
- 5430 Elaina Cir
- 4924 Elaina Ave
- 4919 Elaina Ave
- 4887 Elaina Ave
- 4911 E Mesa Vista Ave
- 4921 E Mesa Vista Ave
- 4901 E Mesa Vista Ave
- 4930 Elaina Ave
- 4925 Elaina Ave
- 4881 Elaina Ave