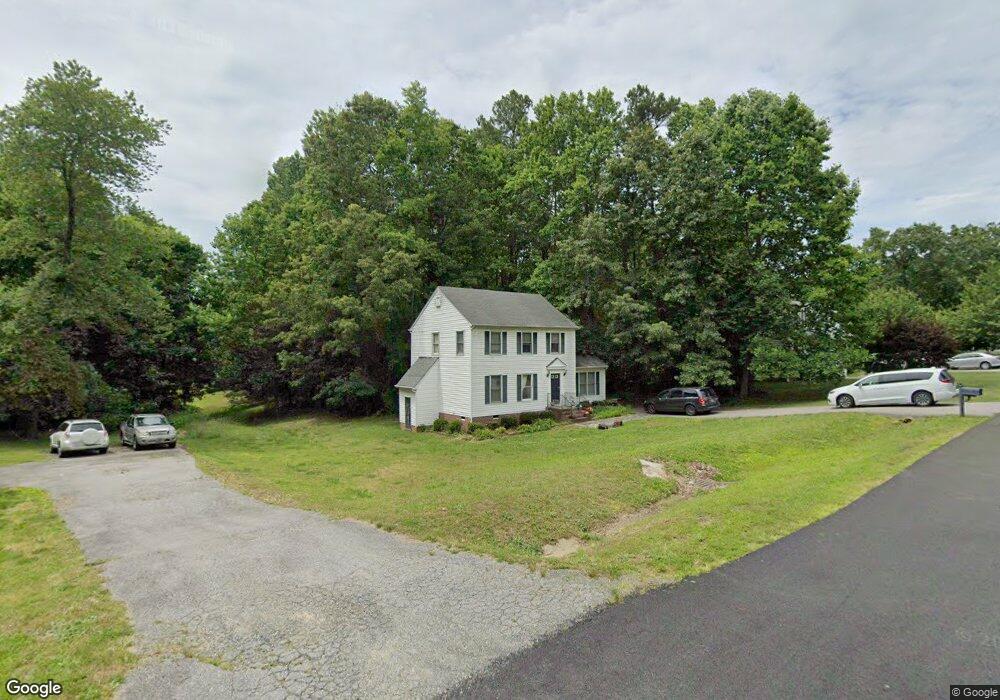
4906 Land Grant Rd North Chesterfield, VA 23236
North Chesterfield NeighborhoodEstimated Value: $357,000 - $403,000
3
Beds
3
Baths
1,620
Sq Ft
$231/Sq Ft
Est. Value
About This Home
This home is located at 4906 Land Grant Rd, North Chesterfield, VA 23236 and is currently estimated at $374,505, approximately $231 per square foot. 4906 Land Grant Rd is a home located in Chesterfield County with nearby schools including Jacobs Road Elementary School, Manchester Middle School, and Clover Hill High.
Ownership History
Date
Name
Owned For
Owner Type
Purchase Details
Closed on
Apr 17, 2025
Sold by
Traumen Llc
Bought by
Sherfey Jacob Ryan and Young Stefan Alexander
Current Estimated Value
Home Financials for this Owner
Home Financials are based on the most recent Mortgage that was taken out on this home.
Original Mortgage
$369,000
Outstanding Balance
$367,356
Interest Rate
6.63%
Mortgage Type
VA
Estimated Equity
$7,149
Purchase Details
Closed on
Dec 23, 2024
Sold by
Parson Tekia C and White Tekia Parson
Bought by
Traumen Llc
Home Financials for this Owner
Home Financials are based on the most recent Mortgage that was taken out on this home.
Original Mortgage
$258,000
Interest Rate
9.5%
Mortgage Type
Construction
Purchase Details
Closed on
Sep 3, 2002
Sold by
Mitchell-Francis Judy
Bought by
Parson Tekia C
Home Financials for this Owner
Home Financials are based on the most recent Mortgage that was taken out on this home.
Original Mortgage
$128,200
Interest Rate
6.55%
Mortgage Type
New Conventional
Create a Home Valuation Report for This Property
The Home Valuation Report is an in-depth analysis detailing your home's value as well as a comparison with similar homes in the area
Home Values in the Area
Average Home Value in this Area
Purchase History
| Date | Buyer | Sale Price | Title Company |
|---|---|---|---|
| Sherfey Jacob Ryan | $369,000 | Fidelity National Title | |
| Sherfey Jacob Ryan | $369,000 | Fidelity National Title | |
| Traumen Llc | $260,000 | Old Republic Title | |
| Parson Tekia C | $134,950 | -- |
Source: Public Records
Mortgage History
| Date | Status | Borrower | Loan Amount |
|---|---|---|---|
| Open | Sherfey Jacob Ryan | $369,000 | |
| Closed | Sherfey Jacob Ryan | $369,000 | |
| Previous Owner | Traumen Llc | $258,000 | |
| Previous Owner | Parson Tekia C | $128,200 |
Source: Public Records
Tax History Compared to Growth
Tax History
| Year | Tax Paid | Tax Assessment Tax Assessment Total Assessment is a certain percentage of the fair market value that is determined by local assessors to be the total taxable value of land and additions on the property. | Land | Improvement |
|---|---|---|---|---|
| 2025 | $2,725 | $303,400 | $63,000 | $240,400 |
| 2024 | $2,725 | $290,100 | $58,000 | $232,100 |
| 2023 | $2,411 | $264,900 | $55,000 | $209,900 |
| 2022 | $2,210 | $240,200 | $52,000 | $188,200 |
| 2021 | $2,106 | $219,100 | $48,000 | $171,100 |
| 2020 | $1,950 | $205,300 | $45,000 | $160,300 |
| 2019 | $1,871 | $196,900 | $44,000 | $152,900 |
| 2018 | $1,831 | $192,700 | $44,000 | $148,700 |
| 2017 | $1,764 | $183,800 | $42,000 | $141,800 |
| 2016 | $1,618 | $168,500 | $40,000 | $128,500 |
| 2015 | $1,546 | $161,000 | $40,000 | $121,000 |
| 2014 | $1,504 | $156,700 | $39,000 | $117,700 |
Source: Public Records
Map
Nearby Homes
- 9165 Chatham Grove Ln
- 4807 Jacobs Glenn Dr
- 8811 S Boones Trail Rd
- 4106 Boonesboro Dr
- 4318 Boones Bluff Way
- 8603 Boones Bluff Mews
- 8511 Long Tom Ct
- 9150 Gregory Dr
- 4110 Fordham Rd
- 8900 Freebridge Rd
- 15418 Millwright Rd
- 8407 Boones Trail Rd
- 5300 Copperpenny Rd
- 9813 Garden Ridge Place
- 4121 Foxglove Rd
- 8832 Lyndale Dr
- 4029 Flintridge Rd
- 5304 Copperpenny Ct
- 3900 Dunraven Rd
- 3832 Foxglove Rd
- 4912 Land Grant Dr
- 4900 Land Grant Rd
- 4900 Land Grant Dr
- 4912 Land Grant Rd
- 9053 Chatham Grove Ln
- 4901 Land Grant Rd
- 4901 Land Grant Dr
- 9007 Locksley Ln
- 9013 Locksley Ln
- 4913 Land Grant Dr
- 4913 Land Grant Rd
- 4907 Cane Mill Ln
- 4918 Land Grant Rd
- 4918 Land Grant Dr
- 4807 Wind Grove Ct
- 9031 Chatham Grove Ln
- 9000 Locksley Ln
- 4806 Wind Grove Ct
- 4919 Land Grant Dr
- 4919 Land Grant Rd