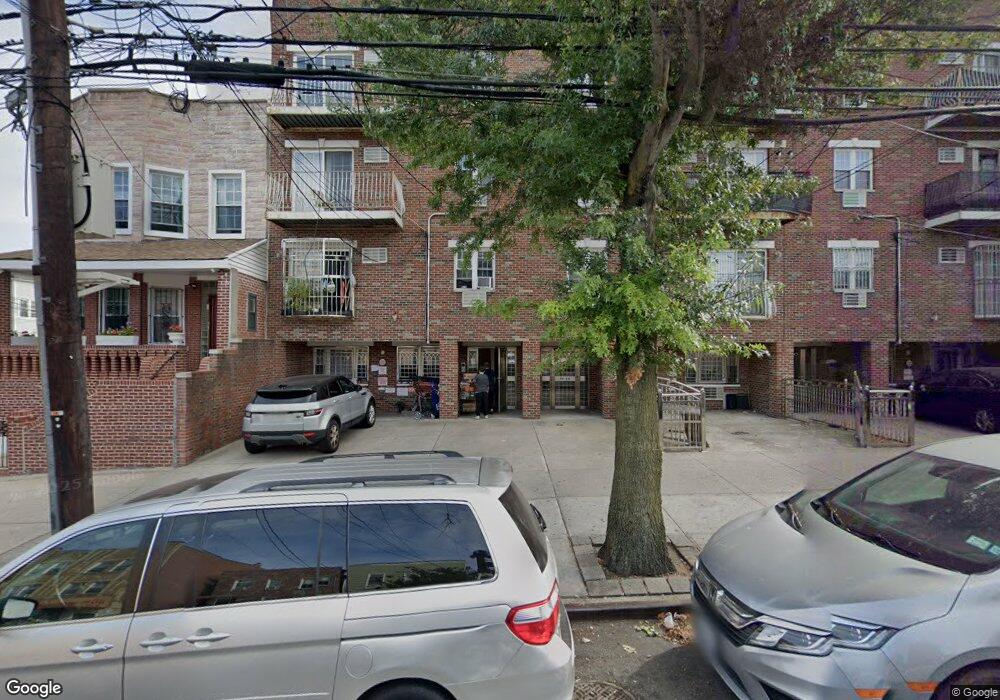
4907 108th St Unit 1A Corona, NY 11368
Corona NeighborhoodEstimated Value: $457,222 - $564,000
--
Bed
--
Bath
856
Sq Ft
$575/Sq Ft
Est. Value
About This Home
This home is located at 4907 108th St Unit 1A, Corona, NY 11368 and is currently estimated at $492,556, approximately $575 per square foot. 4907 108th St Unit 1A is a home located in Queens County with nearby schools including Is 61 Leonardo Da Vinci, John Bowne High School, and Our World Neighborhood Charter School 3.
Ownership History
Date
Name
Owned For
Owner Type
Purchase Details
Closed on
Feb 3, 2021
Sold by
Chen Henry R and Liang Xiuzhen
Bought by
Chen Qumei and Lin Maorong
Current Estimated Value
Home Financials for this Owner
Home Financials are based on the most recent Mortgage that was taken out on this home.
Original Mortgage
$140,000
Outstanding Balance
$125,215
Interest Rate
2.7%
Mortgage Type
Purchase Money Mortgage
Estimated Equity
$367,341
Purchase Details
Closed on
Feb 20, 2018
Sold by
Chen Henry R
Bought by
Chen Henry R and Liang Xiuzhen
Purchase Details
Closed on
Dec 17, 2013
Sold by
Chen Henry R and Xia Fang
Bought by
Chen Henry R
Purchase Details
Closed on
Apr 23, 2009
Sold by
Afmm Llc
Bought by
Chen Henry R and Xia Fang
Home Financials for this Owner
Home Financials are based on the most recent Mortgage that was taken out on this home.
Original Mortgage
$210,000
Interest Rate
5.12%
Mortgage Type
Purchase Money Mortgage
Create a Home Valuation Report for This Property
The Home Valuation Report is an in-depth analysis detailing your home's value as well as a comparison with similar homes in the area
Home Values in the Area
Average Home Value in this Area
Purchase History
| Date | Buyer | Sale Price | Title Company |
|---|---|---|---|
| Chen Qumei | $468,000 | -- | |
| Chen Henry R | -- | -- | |
| Chen Henry R | -- | -- | |
| Chen Henry R | $300,000 | -- |
Source: Public Records
Mortgage History
| Date | Status | Borrower | Loan Amount |
|---|---|---|---|
| Open | Chen Qumei | $140,000 | |
| Previous Owner | Chen Henry R | $210,000 |
Source: Public Records
Tax History Compared to Growth
Tax History
| Year | Tax Paid | Tax Assessment Tax Assessment Total Assessment is a certain percentage of the fair market value that is determined by local assessors to be the total taxable value of land and additions on the property. | Land | Improvement |
|---|---|---|---|---|
| 2025 | $1,146 | $76,527 | $32,970 | $43,557 |
| 2024 | $1,146 | $63,796 | $36,620 | $27,176 |
| 2023 | $1,146 | $53,163 | $44,517 | $8,646 |
| 2022 | $1,125 | $53,856 | $40,689 | $13,167 |
| 2021 | $1,125 | $55,044 | $40,689 | $14,355 |
| 2020 | $1,144 | $60,489 | $40,689 | $19,800 |
| 2019 | $1,157 | $55,757 | $40,689 | $15,068 |
| 2018 | $1,166 | $66,183 | $38,638 | $27,545 |
| 2017 | $1,166 | $61,281 | $40,689 | $20,592 |
| 2016 | $1,182 | $61,281 | $40,689 | $20,592 |
| 2015 | $924 | $61,380 | $40,689 | $20,691 |
| 2014 | $924 | $58,509 | $40,689 | $17,820 |
Source: Public Records
Map
Nearby Homes
- 10827 50th Ave
- 10831 50th Ave Unit 3A
- 10464 48th Ave
- 10605 49th Ave
- 10603 49th Ave
- 108-25 48th Ave
- 108-19 48th Ave
- 104-73 48th Ave
- 104-49 49th Ave
- 10819 48th Ave
- 4913 106th St
- 106-16 Corona Ave
- 108-42 51st Ave
- 10855 48th Ave
- 104-47 49th Ave
- 49-12 111th St
- 49-10 111th St Unit 3A
- 5008 111th St
- 108-51 52nd Ave
- 49-08 111th St Unit 4B
- 4907 108th St Unit 4A
- 4907 108th St Unit 3A
- 4907 108th St Unit 2A
- 4907 108th St
- 4907 108th St Unit 1 A
- 49-7 108th St
- 49-7 108th St Unit 1 A
- 4909 108th St Unit 4A
- 4909 108th St Unit 3A
- 4909 108th St Unit 2A
- 4909 108th St Unit 1A
- 4909 108th St
- 4909 108th St Unit 2A
- 4909 108th St Unit 4A
- 4909 108th St Unit 4
- 4909 108th St
- 4909 108th St Unit 2
- 4903 108th St
- 4911 108th St Unit 4A
- 4911 108th St Unit 3A