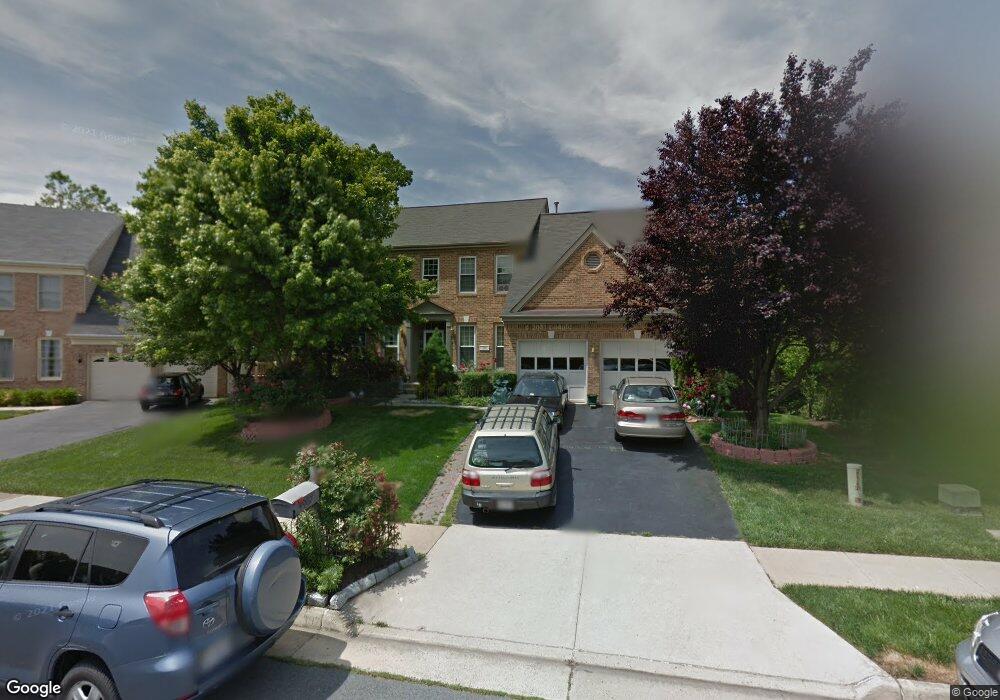
4907 Fox Creek Ct Chantilly, VA 20151
Estimated Value: $1,057,000 - $1,204,000
4
Beds
4
Baths
2,785
Sq Ft
$398/Sq Ft
Est. Value
About This Home
This home is located at 4907 Fox Creek Ct, Chantilly, VA 20151 and is currently estimated at $1,107,553, approximately $397 per square foot. 4907 Fox Creek Ct is a home located in Fairfax County with nearby schools including Poplar Tree Elementary, Rocky Run Middle School, and Chantilly High School.
Ownership History
Date
Name
Owned For
Owner Type
Purchase Details
Closed on
Jun 8, 2023
Sold by
Ko Lai-Lan
Bought by
Lai-Lan Ko and Kong Sze-Hon
Current Estimated Value
Purchase Details
Closed on
Sep 1, 2015
Sold by
Kong Ko Lai Lan
Bought by
Ko Lan Lan
Home Financials for this Owner
Home Financials are based on the most recent Mortgage that was taken out on this home.
Original Mortgage
$234,200
Interest Rate
3.14%
Mortgage Type
New Conventional
Purchase Details
Closed on
Feb 12, 1997
Sold by
Kong + Hon W and Wai K Kong +
Bought by
Ko Lai L K
Purchase Details
Closed on
Oct 27, 1993
Sold by
Centex Real Estate
Bought by
Kong Hon W
Home Financials for this Owner
Home Financials are based on the most recent Mortgage that was taken out on this home.
Original Mortgage
$194,000
Interest Rate
6.86%
Create a Home Valuation Report for This Property
The Home Valuation Report is an in-depth analysis detailing your home's value as well as a comparison with similar homes in the area
Home Values in the Area
Average Home Value in this Area
Purchase History
| Date | Buyer | Sale Price | Title Company |
|---|---|---|---|
| Lai-Lan Ko | -- | None Listed On Document | |
| Ko Lan Lan | -- | None Available | |
| Ko Lai L K | -- | -- | |
| Kong Hon W | $254,830 | -- |
Source: Public Records
Mortgage History
| Date | Status | Borrower | Loan Amount |
|---|---|---|---|
| Previous Owner | Ko Lan Lan | $234,200 | |
| Previous Owner | Kong Hon W | $194,000 |
Source: Public Records
Tax History Compared to Growth
Tax History
| Year | Tax Paid | Tax Assessment Tax Assessment Total Assessment is a certain percentage of the fair market value that is determined by local assessors to be the total taxable value of land and additions on the property. | Land | Improvement |
|---|---|---|---|---|
| 2025 | $11,026 | $961,770 | $349,000 | $612,770 |
| 2024 | $11,026 | $951,770 | $339,000 | $612,770 |
| 2023 | $9,941 | $880,920 | $309,000 | $571,920 |
| 2022 | $9,499 | $830,710 | $294,000 | $536,710 |
| 2021 | $8,521 | $726,160 | $279,000 | $447,160 |
| 2020 | $8,298 | $701,100 | $269,000 | $432,100 |
| 2019 | $8,298 | $701,100 | $269,000 | $432,100 |
| 2018 | $7,634 | $663,860 | $239,000 | $424,860 |
| 2017 | $7,611 | $655,530 | $239,000 | $416,530 |
| 2016 | $7,594 | $655,530 | $239,000 | $416,530 |
| 2015 | $7,164 | $641,920 | $234,000 | $407,920 |
| 2014 | $7,148 | $641,920 | $234,000 | $407,920 |
Source: Public Records
Map
Nearby Homes
- 13611 British Manor Ct
- 13386 Connor Dr Unit D
- 13363 Connor Dr Unit I
- 13369 Connor Dr
- 4828 Heron Neck Ln
- 5126 Brittney Elyse Cir Unit A
- 4511 Stone Pine Ct
- 5123 Travis Edward Way Unit B
- 13329 Connor Dr Unit B
- 4503 Stone Pine Ct
- 4417 Fair Stone Dr Unit 104
- 4413 Fair Stone Dr Unit 306
- 5209 Jule Star Dr
- 5405 Middlebourne Ln
- 5440 Summit St
- 4427 Majestic Ln
- 5019 Village Fountain Place
- 5280 Jule Star Dr
- 5096 Village Fountain Place
- 5459 Serviceberry St
- 4905 Fox Creek Ct
- 4909 Fox Creek Ct
- 4903 Fox Creek Ct
- 4910 Fox Creek Ct
- 4911 Fox Creek Ct
- 4908 Fox Creek Ct
- 4904 Fox Creek Ct
- 4902 Fox Creek Ct
- 4913 Fox Creek Ct
- 4900 Fox Creek Ct
- 13604 Bare Island Dr
- 13606 Bare Island Dr
- 13608 Bare Island Dr
- 13610 Bare Island Dr
- 13614 Bare Island Dr
- 13600 Bare Island Dr
- 13616 Bare Island Dr
- 13618 Bare Island Dr
- 13622 Bare Island Dr
- 13598 Bare Island Dr