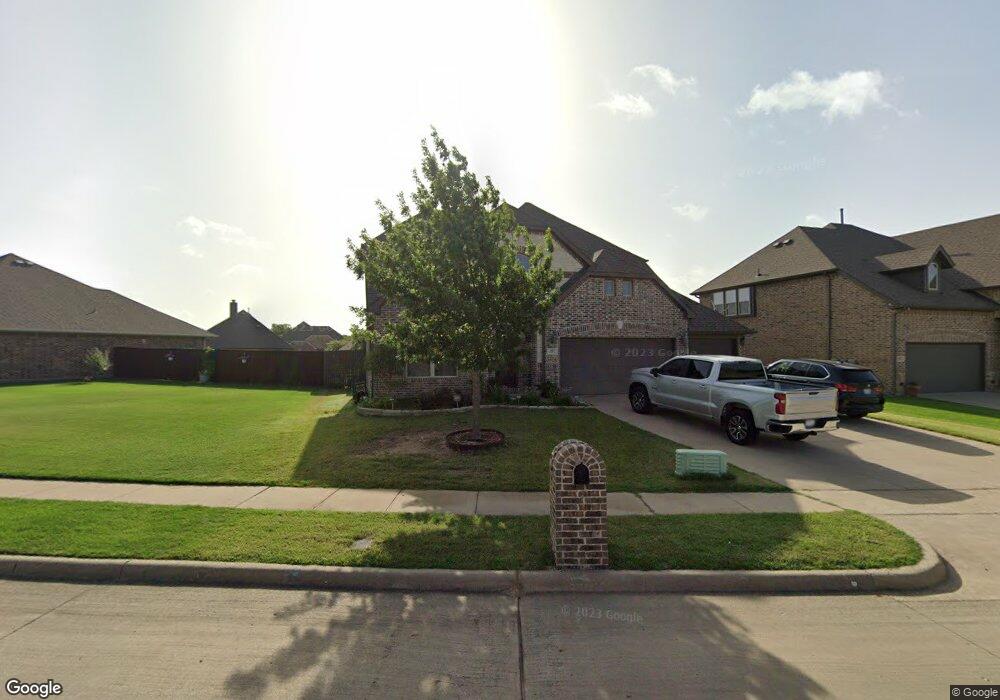
4907 Liberty Hill Trail Sherman, TX 75090
Estimated Value: $477,505 - $551,000
4
Beds
3
Baths
2,650
Sq Ft
$194/Sq Ft
Est. Value
About This Home
This home is located at 4907 Liberty Hill Trail, Sherman, TX 75090 and is currently estimated at $514,253, approximately $194 per square foot. 4907 Liberty Hill Trail is a home located in Grayson County with nearby schools including Percy W. Neblett Elementary School, Dillingham Intermediate School, and Piner Middle School.
Ownership History
Date
Name
Owned For
Owner Type
Purchase Details
Closed on
Apr 22, 2016
Sold by
Seidelman Howard C and Seidelman Jessica R
Bought by
Tran Hung and Truong Hue
Current Estimated Value
Home Financials for this Owner
Home Financials are based on the most recent Mortgage that was taken out on this home.
Original Mortgage
$196,000
Outstanding Balance
$155,710
Interest Rate
3.68%
Mortgage Type
New Conventional
Estimated Equity
$358,543
Purchase Details
Closed on
Dec 22, 2014
Sold by
Stonehollow Homes Llc
Bought by
Seidelman Howard C and Seidelman Jessica R
Home Financials for this Owner
Home Financials are based on the most recent Mortgage that was taken out on this home.
Original Mortgage
$157,881
Interest Rate
4.05%
Mortgage Type
New Conventional
Create a Home Valuation Report for This Property
The Home Valuation Report is an in-depth analysis detailing your home's value as well as a comparison with similar homes in the area
Home Values in the Area
Average Home Value in this Area
Purchase History
| Date | Buyer | Sale Price | Title Company |
|---|---|---|---|
| Tran Hung | -- | Red River Title Co | |
| Seidelman Howard C | -- | Fatco |
Source: Public Records
Mortgage History
| Date | Status | Borrower | Loan Amount |
|---|---|---|---|
| Open | Tran Hung | $196,000 | |
| Previous Owner | Seidelman Howard C | $157,881 |
Source: Public Records
Tax History Compared to Growth
Tax History
| Year | Tax Paid | Tax Assessment Tax Assessment Total Assessment is a certain percentage of the fair market value that is determined by local assessors to be the total taxable value of land and additions on the property. | Land | Improvement |
|---|---|---|---|---|
| 2025 | $8,605 | $509,400 | -- | -- |
| 2024 | $10,157 | $463,091 | $0 | $0 |
| 2023 | $7,733 | $420,992 | $0 | $0 |
| 2022 | $8,970 | $382,720 | $0 | $0 |
| 2021 | $8,721 | $347,927 | $46,341 | $301,586 |
| 2020 | $8,555 | $325,969 | $41,498 | $284,471 |
| 2019 | $8,390 | $311,270 | $23,740 | $287,530 |
| 2018 | $7,564 | $301,503 | $23,740 | $277,763 |
| 2017 | $6,979 | $280,351 | $23,740 | $256,611 |
| 2016 | $6,676 | $268,170 | $23,740 | $244,430 |
| 2015 | $0 | $262,467 | $23,740 | $238,727 |
| 2014 | -- | $13,793 | $13,793 | $0 |
Source: Public Records
Map
Nearby Homes
- 4816 Liberty Hill Trail
- 4817 Ambergate Ln
- 4703 Liberty Hill Trail
- 4701 Camp Verde Cir
- 4616 Liberty Hill Trail
- 108 W North Creek Dr
- 393 Knollwood Rd
- 4909 Indio Ln
- 4934 Dry Creek Rd
- 403 Sonoma Ct
- 227 Cannon Ln
- 4805 Dry Creek Rd
- 506 Southern Dr
- 4721 Dry Creek Rd
- 4713 Dry Creek Rd
- 516 Carneros Dr
- 511 Heritage Ranch Trail
- 413 Heritage Ranch Trail
- 401 Heritage Ranch Trail
- Plan Kahlo at Heritage Ranch - 50ft. lots
- 4903 Liberty Hill Trail
- 4911 Liberty Hill Trail
- 4914 Camp Verde Cir
- 4910 Camp Verde Cir
- 4906 Camp Verde Cir
- 4918 Camp Verde Cir
- 4808 Liberty Hill Trail
- 4812 Liberty Hill Trail
- 4902 Liberty Hill Trail
- 5100 Liberty Hill Trail
- 4906 Liberty Hill Trail
- 5002 Camp Verde Cir
- 4804 Liberty Hill Trail
- 4910 Liberty Hill Trail
- 4909 Camp Verde Cir
- 4905 Camp Verde Cir
- 4913 Camp Verde Cir
- 4800 Liberty Hill Trail
- 4917 Camp Verde Cir
- 4914 Liberty Hill Trail