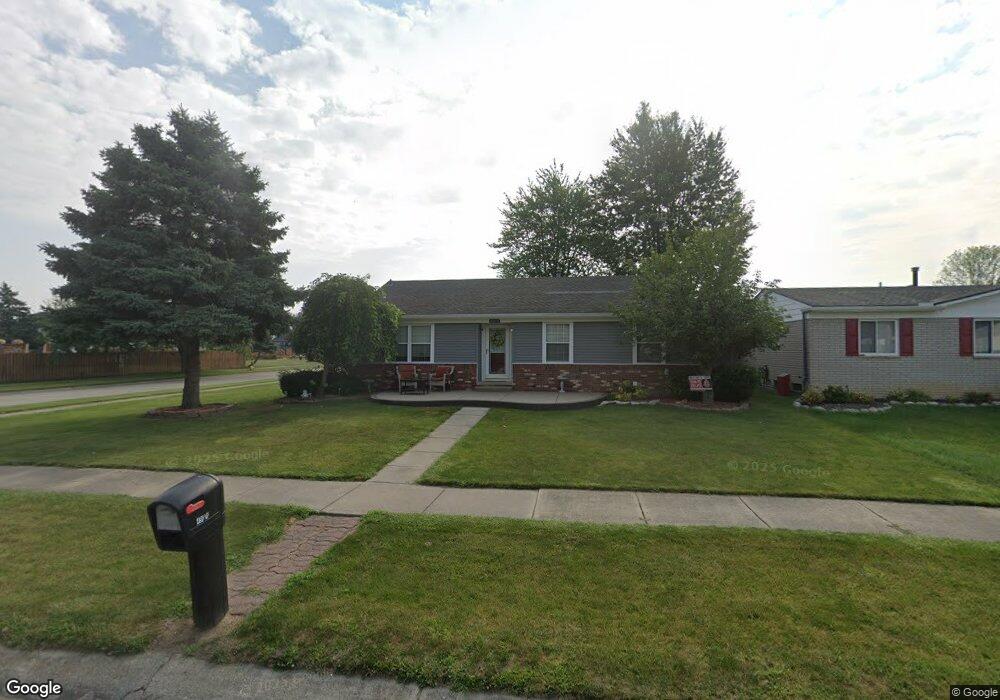
49078 Kimberly Ann Ln Unit Bldg-Unit Chesterfield, MI 48051
Estimated Value: $277,045 - $291,000
3
Beds
1
Bath
1,176
Sq Ft
$242/Sq Ft
Est. Value
About This Home
This home is located at 49078 Kimberly Ann Ln Unit Bldg-Unit, Chesterfield, MI 48051 and is currently estimated at $284,761, approximately $242 per square foot. 49078 Kimberly Ann Ln Unit Bldg-Unit is a home located in Macomb County with nearby schools including L'Anse Creuse High School - North and Austin Catholic Academy.
Ownership History
Date
Name
Owned For
Owner Type
Purchase Details
Closed on
Feb 8, 2018
Sold by
Wimmer Brian A and Hamme Jill A
Bought by
Mowers Lori
Current Estimated Value
Home Financials for this Owner
Home Financials are based on the most recent Mortgage that was taken out on this home.
Original Mortgage
$140,000
Outstanding Balance
$118,567
Interest Rate
3.99%
Mortgage Type
New Conventional
Estimated Equity
$166,194
Purchase Details
Closed on
Oct 13, 2017
Sold by
Wimmer Brian A
Bought by
Deutsche Bank National Trust Co and Argent Securities Inc
Purchase Details
Closed on
Mar 10, 2006
Sold by
Kratz Michael and Kratz Sarah
Bought by
Wimmer Brian A and Hamme Jill A
Purchase Details
Closed on
Apr 11, 2001
Sold by
Forthoffer Kevin J
Bought by
Kratz Michael
Home Financials for this Owner
Home Financials are based on the most recent Mortgage that was taken out on this home.
Original Mortgage
$143,450
Interest Rate
7.03%
Create a Home Valuation Report for This Property
The Home Valuation Report is an in-depth analysis detailing your home's value as well as a comparison with similar homes in the area
Home Values in the Area
Average Home Value in this Area
Purchase History
| Date | Buyer | Sale Price | Title Company |
|---|---|---|---|
| Mowers Lori | $160,000 | None Available | |
| Deutsche Bank National Trust Co | $177,014 | None Available | |
| Wimmer Brian A | $167,000 | Great Lakes Title Of Mi | |
| Kratz Michael | $151,000 | -- |
Source: Public Records
Mortgage History
| Date | Status | Borrower | Loan Amount |
|---|---|---|---|
| Open | Mowers Lori | $140,000 | |
| Previous Owner | Kratz Michael | $143,450 |
Source: Public Records
Tax History Compared to Growth
Tax History
| Year | Tax Paid | Tax Assessment Tax Assessment Total Assessment is a certain percentage of the fair market value that is determined by local assessors to be the total taxable value of land and additions on the property. | Land | Improvement |
|---|---|---|---|---|
| 2025 | $3,508 | $119,000 | $0 | $0 |
| 2024 | $2,402 | $116,100 | $0 | $0 |
| 2023 | $3,174 | $105,200 | $0 | $0 |
| 2022 | $3,174 | $98,500 | $0 | $0 |
| 2021 | $3,087 | $95,900 | $0 | $0 |
| 2020 | $2,091 | $92,100 | $0 | $0 |
| 2019 | $2,844 | $87,000 | $0 | $0 |
| 2018 | $1,712 | $80,800 | $13,800 | $67,000 |
| 2017 | $1,689 | $73,300 | $13,800 | $59,500 |
| 2016 | $1,565 | $73,300 | $0 | $0 |
| 2015 | $643 | $63,200 | $0 | $0 |
| 2014 | $643 | $49,150 | $12,350 | $36,800 |
| 2012 | -- | $0 | $0 | $0 |
Source: Public Records
Map
Nearby Homes
- 48749 Smokey Glen Ct Unit 82
- 26377 Pine Gate Dr
- 27944 Cotton Rd
- 28315 Gold Rd
- 27188 Robin Dr
- 49050 Fuller Rd
- 49431 Fuller Rd
- 49520 Gratiot Ave
- 28326 Nadia Ln
- 28327 Nadia Ln
- 28342 Nadia Ln
- 48075 Meadow Ln
- 26430 Sanajo Ct Unit 20
- 48936 Gratiot Ave
- 48117 Cotton Creek Blvd
- 26326 Pine Gate Dr
- 26314 Pine Gate Dr
- 49157 Maurice Dr
- 48530 Gratiot Ave
- 49263 Stratford Dr
- 49078 Kimberly Ann Ln
- 49066 Kimberly Ann Ln
- 49069 Pine Glen Dr
- 49054 Kimberly Ann Ln
- 49017 Pine Glen Dr
- 49042 Kimberly Ann Ln
- 49201 Kimberly Ann Ln
- 26290 Pine Glen Dr
- 49067 Kimberly Ann Ln
- 27249 Jo Ellen Ct
- 48991 Pine Glen Dr
- 49030 Kimberly Ann Ln
- 49147 Pine Glen Dr
- 27260 Elena Marie Dr
- 49224 Kimberly Ann Ln
- 49044 Pine Glen Dr
- 48965 Pine Glen Dr Unit 93
- 27235 Jo Ellen Ct
- 49096 Pine Glen Dr
- 49018 Kimberly Ann Ln