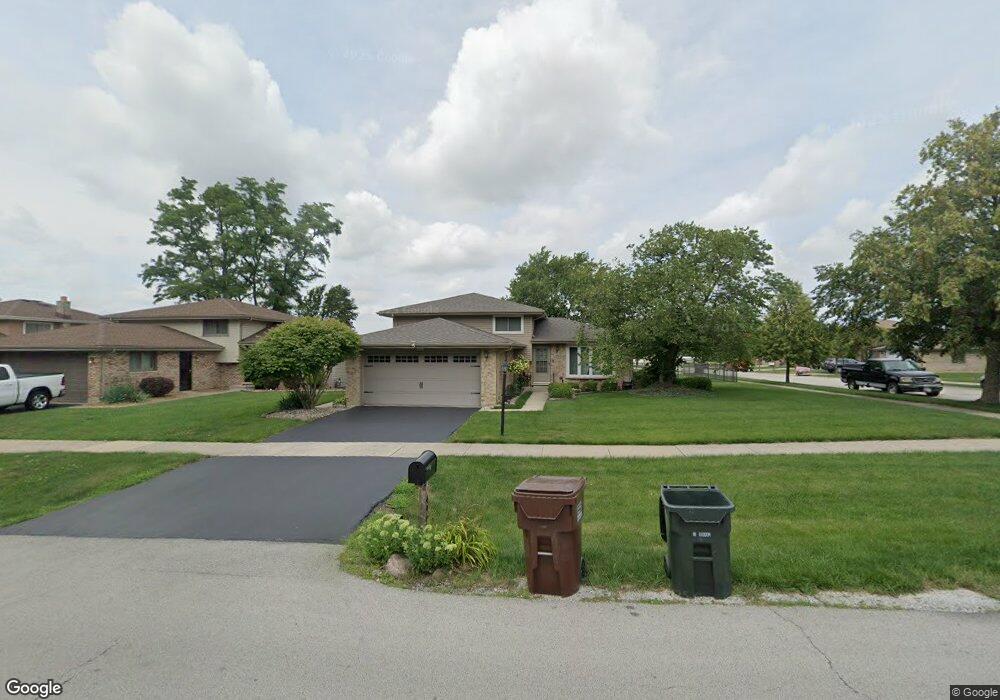
4908 149th St Oak Forest, IL 60452
Estimated Value: $329,164 - $369,000
3
Beds
2
Baths
1,300
Sq Ft
$270/Sq Ft
Est. Value
About This Home
This home is located at 4908 149th St, Oak Forest, IL 60452 and is currently estimated at $350,791, approximately $269 per square foot. 4908 149th St is a home located in Cook County with nearby schools including Kerkstra Elementary School, Jack Hille Middle School, and Oak Forest High School.
Ownership History
Date
Name
Owned For
Owner Type
Purchase Details
Closed on
Oct 21, 2019
Sold by
Patula Timothy J
Bought by
Patula Timothy J and Dygas Emily
Current Estimated Value
Home Financials for this Owner
Home Financials are based on the most recent Mortgage that was taken out on this home.
Original Mortgage
$201,000
Outstanding Balance
$175,839
Interest Rate
3.75%
Mortgage Type
New Conventional
Estimated Equity
$174,952
Purchase Details
Closed on
Jun 29, 2017
Sold by
Malysa Shawn P and Malysa Kelly
Bought by
Patula Timothy J
Home Financials for this Owner
Home Financials are based on the most recent Mortgage that was taken out on this home.
Original Mortgage
$208,549
Interest Rate
4.02%
Mortgage Type
New Conventional
Purchase Details
Closed on
Jul 31, 2000
Sold by
Peffer James T and Peffer Monica C
Bought by
Malysa Shawn P
Home Financials for this Owner
Home Financials are based on the most recent Mortgage that was taken out on this home.
Original Mortgage
$90,000
Interest Rate
8.19%
Create a Home Valuation Report for This Property
The Home Valuation Report is an in-depth analysis detailing your home's value as well as a comparison with similar homes in the area
Home Values in the Area
Average Home Value in this Area
Purchase History
| Date | Buyer | Sale Price | Title Company |
|---|---|---|---|
| Patula Timothy J | -- | Ravenswood Title Company Llc | |
| Patula Timothy J | $215,000 | Ata National Title Group Llc | |
| Malysa Shawn P | $163,000 | -- |
Source: Public Records
Mortgage History
| Date | Status | Borrower | Loan Amount |
|---|---|---|---|
| Open | Patula Timothy J | $201,000 | |
| Closed | Patula Timothy J | $208,549 | |
| Previous Owner | Malysa Shawn P | $90,000 |
Source: Public Records
Tax History
| Year | Tax Paid | Tax Assessment Tax Assessment Total Assessment is a certain percentage of the fair market value that is determined by local assessors to be the total taxable value of land and additions on the property. | Land | Improvement |
|---|---|---|---|---|
| 2025 | $6,784 | $25,000 | $3,813 | $21,187 |
| 2024 | $6,784 | $25,000 | $3,813 | $21,187 |
| 2023 | $6,232 | $25,000 | $3,813 | $21,187 |
| 2022 | $6,232 | $18,265 | $3,390 | $14,875 |
| 2021 | $6,115 | $18,264 | $3,389 | $14,875 |
| 2020 | $5,969 | $18,264 | $3,389 | $14,875 |
| 2019 | $5,473 | $17,018 | $3,177 | $13,841 |
| 2018 | $6,229 | $19,166 | $3,177 | $15,989 |
| 2017 | $6,274 | $19,166 | $3,177 | $15,989 |
| 2016 | $5,619 | $16,171 | $2,965 | $13,206 |
| 2015 | $5,433 | $16,171 | $2,965 | $13,206 |
| 2014 | $5,297 | $16,171 | $2,965 | $13,206 |
| 2013 | $5,167 | $17,431 | $2,965 | $14,466 |
Source: Public Records
Map
Nearby Homes
- 14913 Sheila Ct
- 4734 149th St
- 14655 Lamon Ave Unit 2N
- 14810 Kilpatrick Ave Unit 6E
- 14641 Lavergne Ave
- 14725 Laramie Ave
- 14834 Kenton Ave
- 14828 Kenton Ave
- 15201 Lavergne Ave
- 14927 Kenton Ave
- 15134 Laramie Ave
- 14506 Knox Ave
- 14411 Lamon Ave
- 14409 Lamon Ave
- 4519 152nd St
- 15346 Le Claire Ave
- 14340 Kilpatrick Ave
- 14852 Park Ave
- 15020 Park Ave
- 5332 Crescent Ln Unit C
Your Personal Tour Guide
Ask me questions while you tour the home.