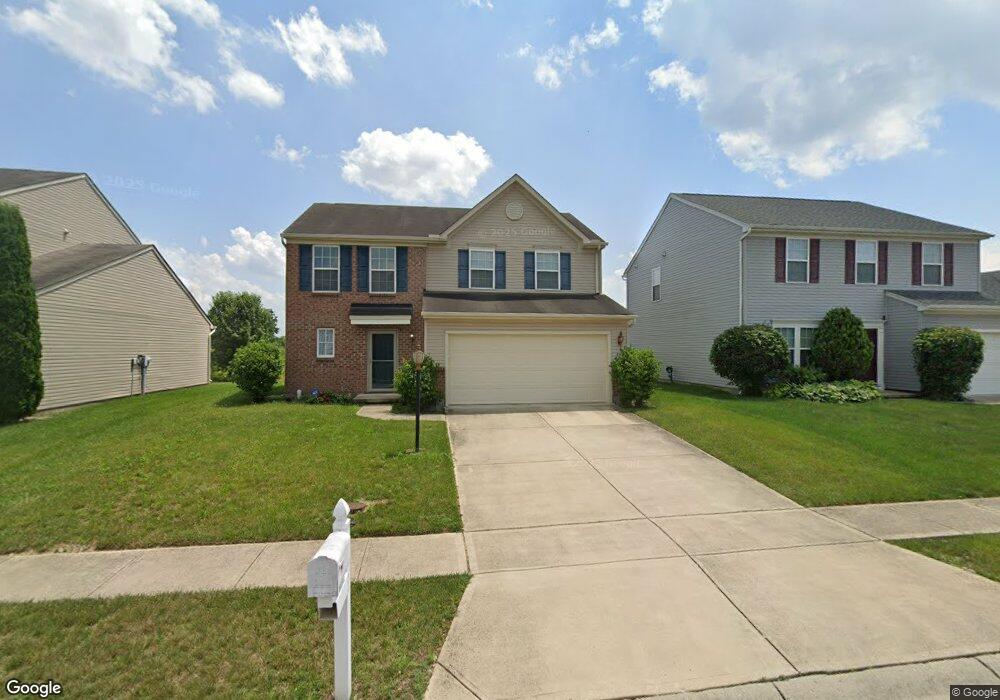
4908 Hopton Loop Dayton, OH 45414
Northridge Estates NeighborhoodEstimated Value: $249,000 - $272,559
3
Beds
3
Baths
1,840
Sq Ft
$142/Sq Ft
Est. Value
About This Home
This home is located at 4908 Hopton Loop, Dayton, OH 45414 and is currently estimated at $260,640, approximately $141 per square foot. 4908 Hopton Loop is a home located in Montgomery County with nearby schools including Northridge High School, Horizon Science Academy-Dayton Elementary School, and North Dayton School of Science & Discovery.
Ownership History
Date
Name
Owned For
Owner Type
Purchase Details
Closed on
Jan 10, 2018
Sold by
James Michael L and Thomas Kristina
Bought by
Woolfolk Wilma
Current Estimated Value
Home Financials for this Owner
Home Financials are based on the most recent Mortgage that was taken out on this home.
Original Mortgage
$98,000
Outstanding Balance
$82,679
Interest Rate
3.93%
Mortgage Type
New Conventional
Estimated Equity
$177,961
Purchase Details
Closed on
Jul 15, 2010
Sold by
Nvr Inc
Bought by
James Michael L
Home Financials for this Owner
Home Financials are based on the most recent Mortgage that was taken out on this home.
Original Mortgage
$101,112
Interest Rate
3.37%
Mortgage Type
New Conventional
Purchase Details
Closed on
May 18, 2010
Sold by
Generation 3 Llc
Bought by
Nvr Inc
Home Financials for this Owner
Home Financials are based on the most recent Mortgage that was taken out on this home.
Original Mortgage
$101,112
Interest Rate
3.37%
Mortgage Type
New Conventional
Create a Home Valuation Report for This Property
The Home Valuation Report is an in-depth analysis detailing your home's value as well as a comparison with similar homes in the area
Home Values in the Area
Average Home Value in this Area
Purchase History
| Date | Buyer | Sale Price | Title Company |
|---|---|---|---|
| Woolfolk Wilma | $129,900 | None Available | |
| James Michael L | $126,400 | None Available | |
| Nvr Inc | $20,000 | None Available |
Source: Public Records
Mortgage History
| Date | Status | Borrower | Loan Amount |
|---|---|---|---|
| Open | Woolfolk Wilma | $98,000 | |
| Previous Owner | James Michael L | $101,112 |
Source: Public Records
Tax History Compared to Growth
Tax History
| Year | Tax Paid | Tax Assessment Tax Assessment Total Assessment is a certain percentage of the fair market value that is determined by local assessors to be the total taxable value of land and additions on the property. | Land | Improvement |
|---|---|---|---|---|
| 2024 | $3,881 | $69,840 | $13,620 | $56,220 |
| 2023 | $3,881 | $69,840 | $13,620 | $56,220 |
| 2022 | $3,163 | $48,840 | $9,520 | $39,320 |
| 2021 | $3,176 | $48,840 | $9,520 | $39,320 |
| 2020 | $3,178 | $48,840 | $9,520 | $39,320 |
| 2019 | $3,283 | $45,770 | $11,200 | $34,570 |
| 2018 | $4,038 | $45,770 | $11,200 | $34,570 |
| 2017 | $3,989 | $45,770 | $11,200 | $34,570 |
| 2016 | $4,009 | $45,770 | $11,200 | $34,570 |
| 2015 | $3,708 | $45,770 | $11,200 | $34,570 |
| 2014 | $3,708 | $45,770 | $11,200 | $34,570 |
| 2012 | -- | $47,790 | $11,200 | $36,590 |
Source: Public Records
Map
Nearby Homes
- 5417 Abby Loop Way
- 455 Shiloh Dr
- 473 Blueridge Dr
- 270 Pamela Ave
- 316 Park End Dr
- 5473 Fair Valley Rd
- 5563 Fair Valley Rd
- 1376 Bartley Rd
- 158 Loretta Dr
- 2246 Woodson Dr
- 531 Burgess Ave
- 2006 High Knoll Dr
- 8090 Dog Leg Rd
- 5653 Philadelphia Dr
- 111 Folsom Dr
- 1081 Rydale Rd
- 1657 Scenic Dr
- 6029 Imperial Hills Dr
- 209 Julia Ave
- 6012 Imperial Hills Dr
- 4914 Hopton Loop
- 4902 Hopton Loop
- 4920 Hopton Loop
- 5318 Rivers Edge Blvd
- 5402 Galt Ct
- 4926 Hopton Loop
- 5408 Galt Ct
- 5309 Rivers Edge Blvd
- 4932 Hopton Loop
- 5303 Rivers Edge Blvd
- 5315 Rivers Edge Blvd
- 5330 Rivers Edge Blvd
- 5323 Rivers Edge Blvd
- 4938 Hopton Loop
- 4935 Hopton Loop
- 5414 Galt Ct
- 5336 Rivers Edge Blvd
- 5521 Abby Loop Way
- 5420 Galt Ct
- 5335 Rivers Edge Blvd