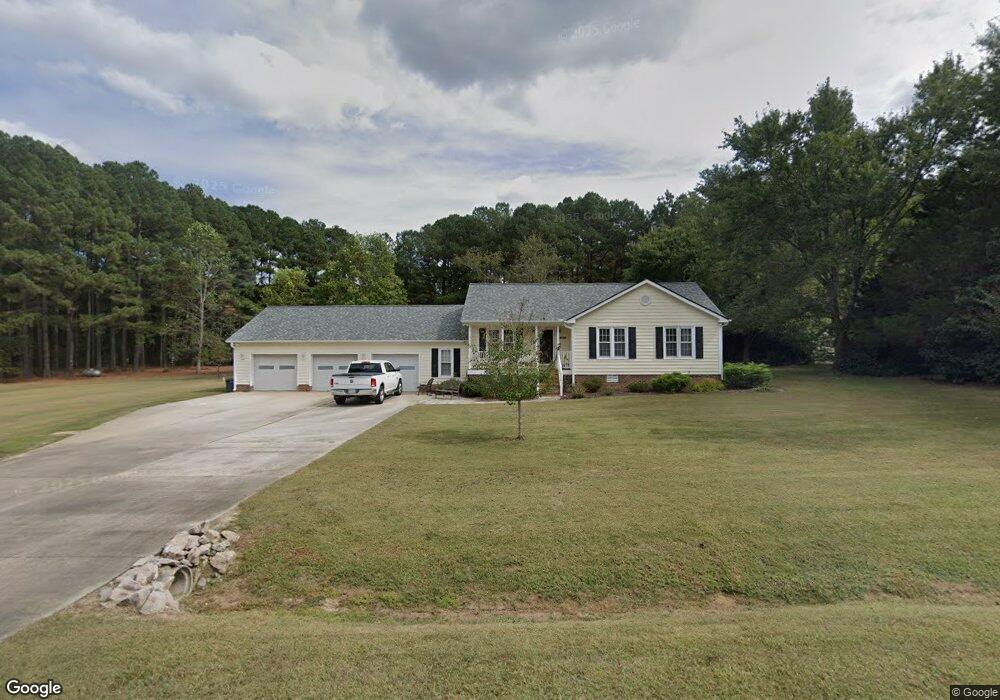
4908 Huntingcreek Dr Wake Forest, NC 27587
Estimated Value: $336,000 - $380,000
--
Bed
2
Baths
1,222
Sq Ft
$290/Sq Ft
Est. Value
About This Home
This home is located at 4908 Huntingcreek Dr, Wake Forest, NC 27587 and is currently estimated at $354,945, approximately $290 per square foot. 4908 Huntingcreek Dr is a home located in Wake County with nearby schools including Rolesville Elementary School, Rolesville Middle School, and Rolesville High School.
Ownership History
Date
Name
Owned For
Owner Type
Purchase Details
Closed on
Mar 24, 2011
Sold by
Yocum Terry E and Yocum Jacquelyn I
Bought by
The Terry & Jacquelyn Yocum Revocable Li
Current Estimated Value
Purchase Details
Closed on
Dec 1, 2010
Sold by
The Terry & Jacquely Yocum Revocable Liv
Bought by
Yocum Terry E and Yocum Jacquelyn I
Purchase Details
Closed on
Jul 30, 2008
Sold by
Yocum Terry E and Yocum Jacquelyn I
Bought by
Yocum Terry Edward and Yocum Jacquelyn Ina
Purchase Details
Closed on
Mar 24, 2003
Sold by
Stever Dennis B and Stever Jane L
Bought by
Yocum Terry E and Yocum Jacquelyn I
Home Financials for this Owner
Home Financials are based on the most recent Mortgage that was taken out on this home.
Original Mortgage
$123,200
Outstanding Balance
$52,886
Interest Rate
5.86%
Estimated Equity
$302,059
Create a Home Valuation Report for This Property
The Home Valuation Report is an in-depth analysis detailing your home's value as well as a comparison with similar homes in the area
Home Values in the Area
Average Home Value in this Area
Purchase History
| Date | Buyer | Sale Price | Title Company |
|---|---|---|---|
| The Terry & Jacquelyn Yocum Revocable Li | -- | None Available | |
| Yocum Terry E | -- | None Available | |
| Yocum Terry Edward | -- | None Available | |
| Yocum Terry E | $154,000 | -- |
Source: Public Records
Mortgage History
| Date | Status | Borrower | Loan Amount |
|---|---|---|---|
| Open | Yocum Terry E | $123,200 | |
| Closed | Yocum Terry E | $15,400 |
Source: Public Records
Tax History Compared to Growth
Tax History
| Year | Tax Paid | Tax Assessment Tax Assessment Total Assessment is a certain percentage of the fair market value that is determined by local assessors to be the total taxable value of land and additions on the property. | Land | Improvement |
|---|---|---|---|---|
| 2025 | $1,149 | $353,099 | $110,000 | $243,099 |
| 2024 | $1,116 | $353,099 | $110,000 | $243,099 |
| 2023 | $886 | $222,180 | $54,000 | $168,180 |
| 2022 | $1,625 | $222,180 | $54,000 | $168,180 |
| 2021 | $1,581 | $222,180 | $54,000 | $168,180 |
| 2020 | $1,555 | $222,180 | $54,000 | $168,180 |
| 2019 | $1,735 | $210,023 | $45,900 | $164,123 |
| 2018 | $1,596 | $210,023 | $45,900 | $164,123 |
| 2017 | $1,513 | $210,023 | $45,900 | $164,123 |
| 2016 | $1,483 | $210,023 | $45,900 | $164,123 |
| 2015 | $1,456 | $206,708 | $44,000 | $162,708 |
| 2014 | $1,380 | $206,708 | $44,000 | $162,708 |
Source: Public Records
Map
Nearby Homes
- 4225 Burlington Mills Rd
- 1035 Evening Shade Ave
- 1201 Argentum St
- 505 Kenton Mill Ct
- 4804 Pine Glen Ct
- 11249 Jeffreys Ln
- 5021 Red Quill Way
- 917 Evening Snow St
- 4628 Rogers Rd
- 1317 Mackinaw Dr
- 2464 Everstone Rd
- 1212 Mackinaw Dr
- 3810 Prince Noah Loop
- 1413 Yardley Dr
- 1123 Ambrose Dr
- 703 Jamescroft Way
- 707 Jamescroft Way
- 2242 Sweet Annie Way
- 609 Marshskip Way
- 607 Marshskip Way
- 4908 Hunting Creek Dr
- 4912 Huntingcreek Dr
- 4904 Huntingcreek Dr
- 4905 Huntingcreek Dr
- 4905 Hunting Creek Dr
- 4412 Hunting Creek Dr
- 4917 Huntingcreek Dr
- 4900 Huntingcreek Dr
- 4401 Burlington Mills Rd
- 4925 Huntingcreek Dr
- 4400 Trayer Ln
- 4308 Burlington Mills Rd
- 4909 Huntmaster Trail
- 4413 Burlington Mills Rd
- 4245 Burlington Mills Rd
- 4905 Huntmaster Trail
- 4412 Trayer Ln
- 4929 Huntingcreek Dr
- 4417 Burlington Mills Rd
- 4917 Huntmaster Trail