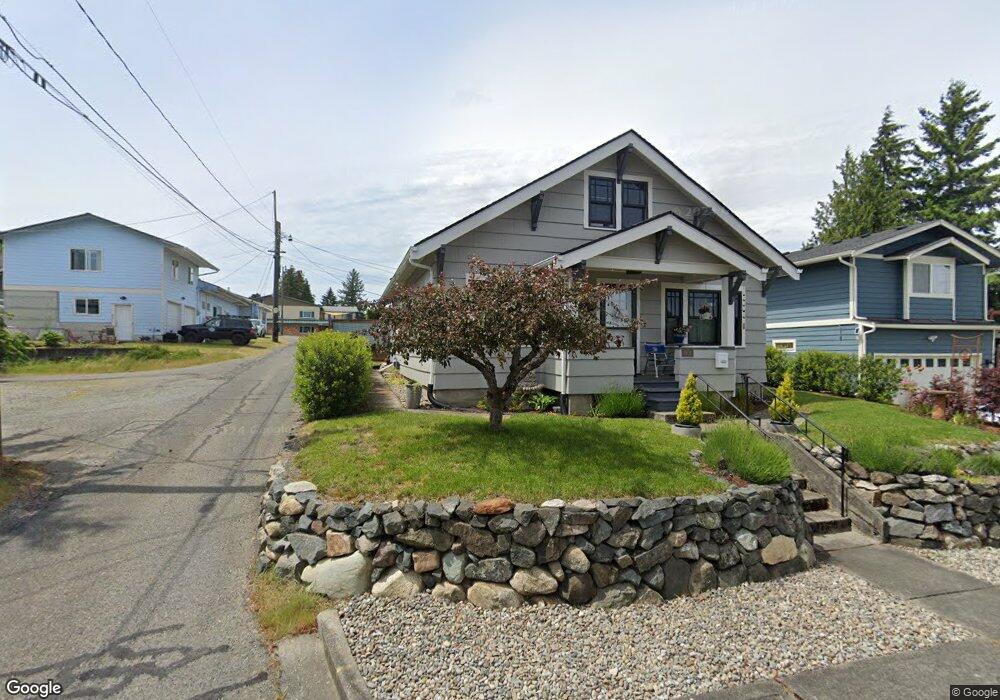
4908 N Highland St Ruston, WA 98407
Estimated Value: $520,000 - $563,000
4
Beds
1
Bath
1,512
Sq Ft
$357/Sq Ft
Est. Value
About This Home
This home is located at 4908 N Highland St, Ruston, WA 98407 and is currently estimated at $539,417, approximately $356 per square foot. 4908 N Highland St is a home located in Pierce County with nearby schools including Point Defiance Elementary School, Truman Middle School, and Dr. Dolores Silas High School.
Ownership History
Date
Name
Owned For
Owner Type
Purchase Details
Closed on
Mar 26, 2007
Sold by
Coker Christopher J
Bought by
Ficiala Bryan L
Current Estimated Value
Home Financials for this Owner
Home Financials are based on the most recent Mortgage that was taken out on this home.
Original Mortgage
$192,000
Outstanding Balance
$116,980
Interest Rate
6.29%
Mortgage Type
Purchase Money Mortgage
Estimated Equity
$422,437
Purchase Details
Closed on
Nov 26, 2003
Sold by
Mriglot Terry G
Bought by
Mriglot Lori K
Purchase Details
Closed on
Aug 5, 2002
Sold by
Morris Edward W
Bought by
Ivy Land Company Inc
Create a Home Valuation Report for This Property
The Home Valuation Report is an in-depth analysis detailing your home's value as well as a comparison with similar homes in the area
Home Values in the Area
Average Home Value in this Area
Purchase History
| Date | Buyer | Sale Price | Title Company |
|---|---|---|---|
| Ficiala Bryan L | $240,000 | Lawyers Title | |
| Mriglot Lori K | -- | Chicago Title | |
| Ivy Land Company Inc | $103,500 | Chicago Title | |
| Hoover Lori K | -- | -- |
Source: Public Records
Mortgage History
| Date | Status | Borrower | Loan Amount |
|---|---|---|---|
| Open | Ficiala Bryan L | $192,000 |
Source: Public Records
Tax History Compared to Growth
Tax History
| Year | Tax Paid | Tax Assessment Tax Assessment Total Assessment is a certain percentage of the fair market value that is determined by local assessors to be the total taxable value of land and additions on the property. | Land | Improvement |
|---|---|---|---|---|
| 2025 | $4,257 | $493,800 | $300,000 | $193,800 |
| 2024 | $4,257 | $485,500 | $289,500 | $196,000 |
| 2023 | $4,257 | $454,800 | $251,200 | $203,600 |
| 2022 | $3,806 | $457,300 | $262,800 | $194,500 |
| 2021 | $3,538 | $325,400 | $167,300 | $158,100 |
| 2019 | $2,863 | $296,700 | $141,200 | $155,500 |
| 2018 | $3,057 | $276,400 | $127,300 | $149,100 |
| 2017 | $2,683 | $236,800 | $95,100 | $141,700 |
| 2016 | $2,499 | $179,200 | $71,900 | $107,300 |
| 2014 | $2,278 | $169,000 | $69,100 | $99,900 |
| 2013 | $2,278 | $155,100 | $61,900 | $93,200 |
Source: Public Records
Map
Nearby Homes
- 4945 N Pearl St
- 5006 N Winnifred St
- 5709 N 48th St
- 5301 N Commercial St
- 4635 N Defiance St
- 5207 N Pearl St Unit RUS
- 5302 N 49th St
- 5013 N Whitman St
- 5348 N 47th St
- 5137 N 46th St
- 4609 N Vassault St
- 5302 N Shirley St
- 5128 N 49th St
- 4405 N Pearl St
- 4911 N Mildred St
- 5105 Grand Loop Unit 105
- 4202 N Pearl St
- 4818 N Ferdinand St
- 4961 Main St Unit 416
- 4961 Main St Unit 802
- 4914 N Highland St
- 5635 5639 N 49th St
- 5635 N 49th St
- 4927 N Pearl St
- 5639 N 49th St
- 4931 N Pearl St
- 4920 N Highland St
- 5629 N 49th St
- 4911 N Highland St
- 4939 N Pearl St
- 4915 N Highland St
- 4924 N Highland St
- 4925 N Highland St
- 5623 N 49th St
- 5808 N 50th St
- 4910 N Winnifred Place
- 4947 N Pearl St
- 4914 N Winnifred Place
- 4930 N Pearl St