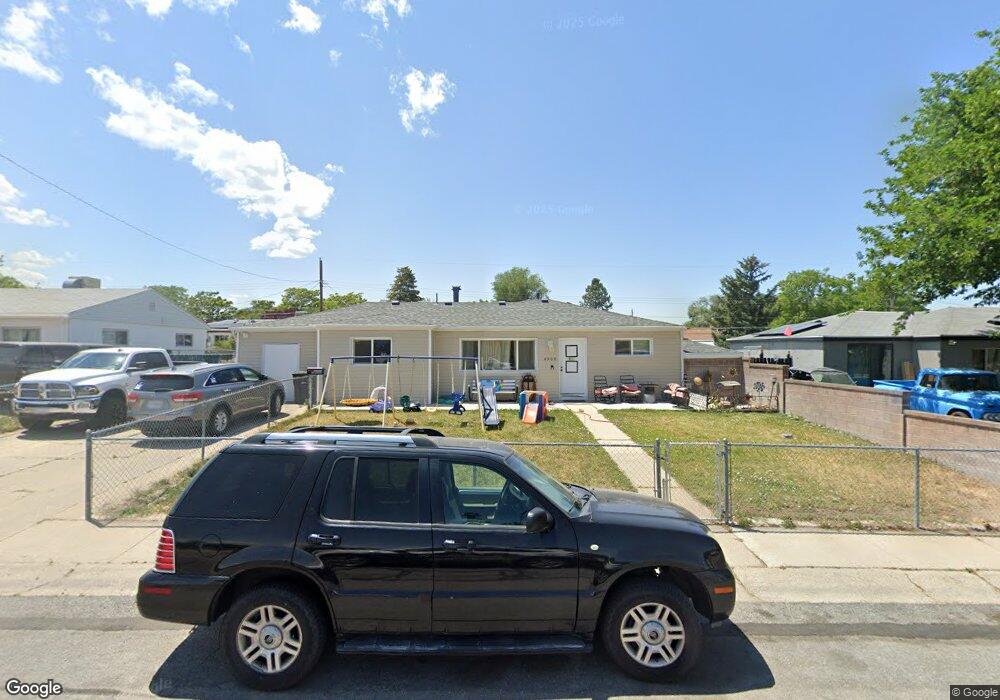
4908 S 4300 W Salt Lake City, UT 84118
Estimated Value: $365,000 - $434,000
4
Beds
2
Baths
1,180
Sq Ft
$341/Sq Ft
Est. Value
About This Home
This home is located at 4908 S 4300 W, Salt Lake City, UT 84118 and is currently estimated at $402,736, approximately $341 per square foot. 4908 S 4300 W is a home located in Salt Lake County with nearby schools including David Gourley Elementary School, Kearns Jr High School, and Kearns High School.
Ownership History
Date
Name
Owned For
Owner Type
Purchase Details
Closed on
Mar 3, 2021
Sold by
Pidgeon Melissa L
Bought by
Pidgeon Cory Lee and Pidgeon Melissa Lynn
Current Estimated Value
Home Financials for this Owner
Home Financials are based on the most recent Mortgage that was taken out on this home.
Original Mortgage
$167,800
Interest Rate
2.7%
Mortgage Type
New Conventional
Purchase Details
Closed on
Feb 11, 2014
Sold by
Reynolds George C
Bought by
Reynolds George C and Pidgeon Melissa L
Create a Home Valuation Report for This Property
The Home Valuation Report is an in-depth analysis detailing your home's value as well as a comparison with similar homes in the area
Home Values in the Area
Average Home Value in this Area
Purchase History
| Date | Buyer | Sale Price | Title Company |
|---|---|---|---|
| Pidgeon Cory Lee | -- | Investors Title Ins Agcy | |
| Reynolds George C | -- | None Available |
Source: Public Records
Mortgage History
| Date | Status | Borrower | Loan Amount |
|---|---|---|---|
| Closed | Pidgeon Cory Lee | $167,800 |
Source: Public Records
Tax History Compared to Growth
Tax History
| Year | Tax Paid | Tax Assessment Tax Assessment Total Assessment is a certain percentage of the fair market value that is determined by local assessors to be the total taxable value of land and additions on the property. | Land | Improvement |
|---|---|---|---|---|
| 2025 | $2,634 | $375,100 | $84,100 | $291,000 |
| 2024 | $2,634 | $354,700 | $79,000 | $275,700 |
| 2023 | $2,476 | $320,200 | $75,900 | $244,300 |
| 2022 | $2,517 | $334,300 | $74,500 | $259,800 |
| 2021 | $2,283 | $274,500 | $57,300 | $217,200 |
| 2020 | $1,619 | $230,200 | $52,200 | $178,000 |
| 2019 | $2,097 | $229,100 | $49,200 | $179,900 |
| 2018 | $2,229 | $213,400 | $49,200 | $164,200 |
| 2017 | $1,445 | $183,700 | $49,200 | $134,500 |
| 2016 | $1,445 | $157,200 | $45,400 | $111,800 |
| 2015 | $1,501 | $135,700 | $55,400 | $80,300 |
| 2014 | $1,322 | $124,300 | $51,400 | $72,900 |
Source: Public Records
Map
Nearby Homes