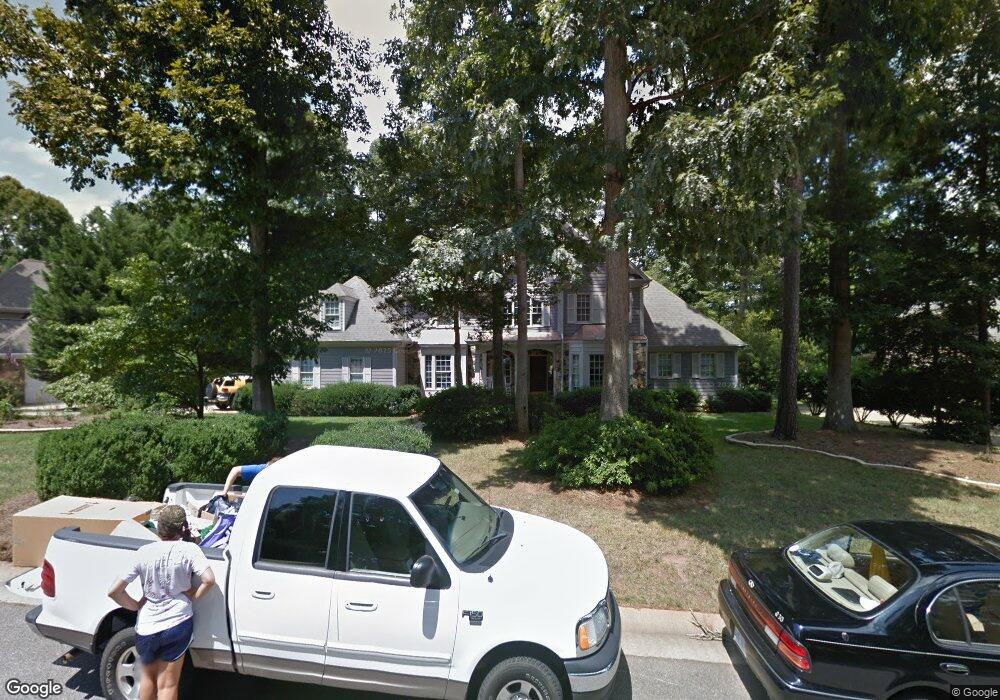
4908 Sunset Forest Cir Holly Springs, NC 27540
Estimated Value: $907,000 - $1,041,000
5
Beds
4
Baths
3,964
Sq Ft
$249/Sq Ft
Est. Value
About This Home
This home is located at 4908 Sunset Forest Cir, Holly Springs, NC 27540 and is currently estimated at $986,329, approximately $248 per square foot. 4908 Sunset Forest Cir is a home located in Wake County with nearby schools including Holly Ridge Elementary School, Holly Ridge Middle School, and Holly Springs High School.
Ownership History
Date
Name
Owned For
Owner Type
Purchase Details
Closed on
Jan 21, 2020
Sold by
Li Jianbo and Li Linda
Bought by
Appelt Bernd and Appelt Heike
Current Estimated Value
Purchase Details
Closed on
May 30, 2017
Sold by
Rossi Elisa Ann
Bought by
Li Jianbo and Li Linda
Home Financials for this Owner
Home Financials are based on the most recent Mortgage that was taken out on this home.
Original Mortgage
$412,000
Interest Rate
3.97%
Mortgage Type
New Conventional
Purchase Details
Closed on
Feb 5, 2016
Sold by
Sgherza Joseph F
Bought by
Rossi Elisa Ann and Sgherza Elisa A
Purchase Details
Closed on
May 27, 2002
Sold by
Moffat Robert W and Moffat Amor B
Bought by
Sgherza Joseph F and Sgherza Elisa A
Home Financials for this Owner
Home Financials are based on the most recent Mortgage that was taken out on this home.
Original Mortgage
$322,700
Interest Rate
5.74%
Create a Home Valuation Report for This Property
The Home Valuation Report is an in-depth analysis detailing your home's value as well as a comparison with similar homes in the area
Home Values in the Area
Average Home Value in this Area
Purchase History
| Date | Buyer | Sale Price | Title Company |
|---|---|---|---|
| Appelt Bernd | $570,000 | None Available | |
| Appelt Bernd | $570,000 | None Listed On Document | |
| Li Jianbo | $515,000 | None Available | |
| Rossi Elisa Ann | -- | None Available | |
| Sgherza Joseph F | $472,000 | -- |
Source: Public Records
Mortgage History
| Date | Status | Borrower | Loan Amount |
|---|---|---|---|
| Previous Owner | Li Jianbo | $412,000 | |
| Previous Owner | Sgherza Joseph F | $322,700 | |
| Closed | Sgherza Joseph F | $75,000 |
Source: Public Records
Tax History Compared to Growth
Tax History
| Year | Tax Paid | Tax Assessment Tax Assessment Total Assessment is a certain percentage of the fair market value that is determined by local assessors to be the total taxable value of land and additions on the property. | Land | Improvement |
|---|---|---|---|---|
| 2025 | $8,655 | $1,003,375 | $232,500 | $770,875 |
| 2024 | $8,619 | $1,003,375 | $232,500 | $770,875 |
| 2023 | $6,455 | $596,592 | $113,750 | $482,842 |
| 2022 | $6,231 | $596,592 | $113,750 | $482,842 |
| 2021 | $6,115 | $596,592 | $113,750 | $482,842 |
| 2020 | $6,115 | $596,592 | $113,750 | $482,842 |
| 2019 | $4,998 | $579,992 | $117,000 | $462,992 |
| 2018 | $3,000 | $579,992 | $117,000 | $462,992 |
| 2017 | $6,095 | $579,992 | $117,000 | $462,992 |
| 2016 | $6,011 | $579,992 | $117,000 | $462,992 |
| 2015 | $6,408 | $608,690 | $145,600 | $463,090 |
| 2014 | $6,186 | $608,690 | $145,600 | $463,090 |
Source: Public Records
Map
Nearby Homes
- 4809 Greenpoint Ln
- 305 Savannah Ridge Rd
- 215 Savannah Ridge Rd Unit 215
- 204 Crossway Ln
- 129 Starwood Ln
- 0/416 Holly Springs Rd
- 5200 Gable Ridge Ln
- 201 Seagraves Creek Ln
- 113 Seagraves Creek Ln
- 124 Seagraves Creek Ln
- 120 Seagraves Creek Ln
- 116 Seagraves Creek Ln
- 204 Seagraves Creek Ln
- 200 Seagraves Creek Ln
- 108 Warm Wood Ln
- 5309 Shoreline Ct
- 4900 Optimist Farm Rd
- 5317 Moonflower Ct
- 112 Midden Way
- 103 Pleasant Glen Ln
- 4904 Sunset Forest Cir
- 4913 Sunset Forest Cir
- 4900 Sunset Forest Cir
- 4909 Sunset Forest Cir
- 4916 Sunset Forest Cir
- 4917 Sunset Forest Cir
- 4905 Sunset Forest Cir
- 4920 Sunset Forest Cir
- 4901 Sunset Forest Cir
- 4905 Northoak Ct
- 4708 Greenpoint Ln
- 4704 Greenpoint Ln
- 4800 Greenpoint Ln
- 5001 Sunset Forest Cir
- 4701 Greenpoint Ln
- 4804 Greenpoint Ln
- 4924 Sunset Forest Cir
- 4901 Northoak Ct
- 4808 Greenpoint Ln
- 4705 Greenpoint Ln