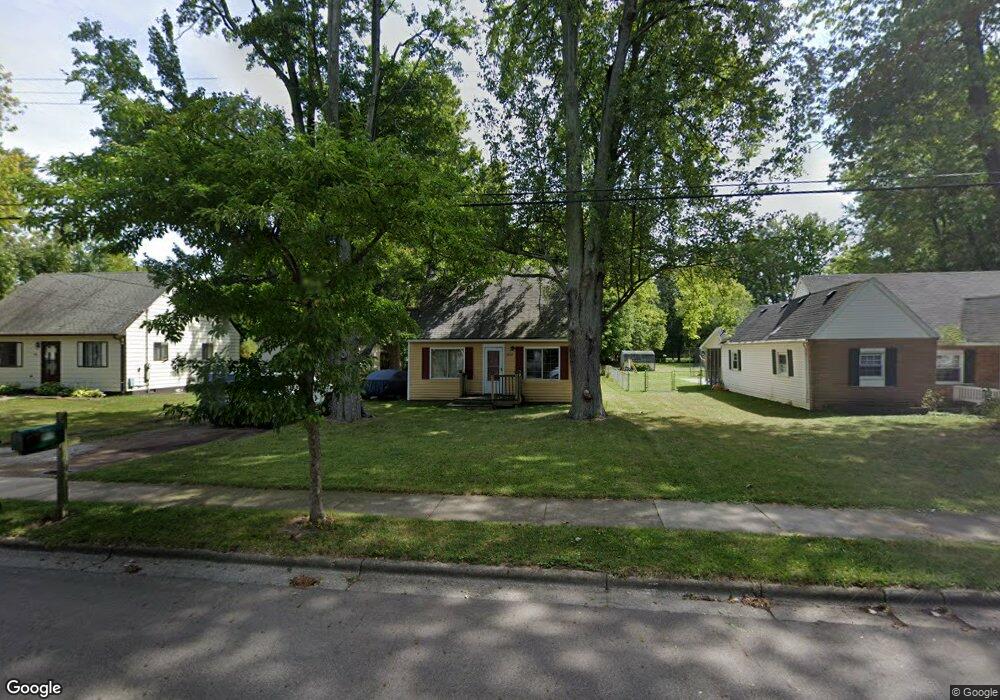
4909 Ingham St Lansing, MI 48911
Pleasant Grove NeighborhoodEstimated Value: $91,000 - $130,000
2
Beds
1
Bath
715
Sq Ft
$148/Sq Ft
Est. Value
About This Home
This home is located at 4909 Ingham St, Lansing, MI 48911 and is currently estimated at $106,091, approximately $148 per square foot. 4909 Ingham St is a home located in Ingham County with nearby schools including Reo Elementary School, Attwood School, and Everett High School.
Ownership History
Date
Name
Owned For
Owner Type
Purchase Details
Closed on
Jan 23, 2024
Sold by
Young Antonio
Bought by
Sway Properties Inc
Current Estimated Value
Purchase Details
Closed on
Mar 8, 2002
Sold by
Hyatt James F
Bought by
Young Antonio
Home Financials for this Owner
Home Financials are based on the most recent Mortgage that was taken out on this home.
Original Mortgage
$51,688
Interest Rate
6.82%
Mortgage Type
FHA
Purchase Details
Closed on
Aug 20, 1999
Sold by
Peasley Leo M and Peasley Dorothea M
Bought by
Hyatt James F
Home Financials for this Owner
Home Financials are based on the most recent Mortgage that was taken out on this home.
Original Mortgage
$35,327
Interest Rate
7.59%
Mortgage Type
FHA
Create a Home Valuation Report for This Property
The Home Valuation Report is an in-depth analysis detailing your home's value as well as a comparison with similar homes in the area
Home Values in the Area
Average Home Value in this Area
Purchase History
| Date | Buyer | Sale Price | Title Company |
|---|---|---|---|
| Sway Properties Inc | $20,800 | National Title | |
| Young Antonio | $52,500 | -- | |
| Hyatt James F | $35,000 | -- |
Source: Public Records
Mortgage History
| Date | Status | Borrower | Loan Amount |
|---|---|---|---|
| Previous Owner | Young Antonio | $51,688 | |
| Previous Owner | Hyatt James F | $35,327 |
Source: Public Records
Tax History Compared to Growth
Tax History
| Year | Tax Paid | Tax Assessment Tax Assessment Total Assessment is a certain percentage of the fair market value that is determined by local assessors to be the total taxable value of land and additions on the property. | Land | Improvement |
|---|---|---|---|---|
| 2025 | $1,966 | $41,100 | $14,000 | $27,100 |
| 2024 | $14 | $35,900 | $14,000 | $21,900 |
| 2023 | $1,323 | $31,700 | $14,000 | $17,700 |
| 2022 | $1,198 | $26,200 | $9,800 | $16,400 |
| 2021 | $1,173 | $22,700 | $7,200 | $15,500 |
| 2020 | $1,165 | $20,700 | $7,200 | $13,500 |
| 2019 | $1,114 | $19,900 | $7,200 | $12,700 |
| 2018 | $1,048 | $17,600 | $7,200 | $10,400 |
| 2017 | $1,002 | $17,600 | $7,200 | $10,400 |
| 2016 | $1,042 | $16,800 | $7,200 | $9,600 |
| 2015 | $1,042 | $16,300 | $14,444 | $1,856 |
| 2014 | $1,042 | $17,600 | $0 | $0 |
Source: Public Records
Map
Nearby Homes
- 4828 Ingham St
- 4809 Ballard Rd
- 2416 Midwood St
- 4628 Pleasant Grove Rd
- 3115 Risdale Ave
- 2816 Greenbelt Dr
- 4110 Richmond St
- 2311 Greenbelt Dr
- 5100 Wexford Rd
- 4017 Richmond St
- 2045 Moffitt St
- 4620 Christiansen Rd
- 0 Midwood St
- 3600 Ronald St
- 3006 Hillcrest St
- 4000 Churchill Ave
- 1729 Reo Rd
- 2029 Hillcrest St
- 4916 Tressa Dr
- 3100 Glenbrook Dr
- 4915 Ingham St
- 4901 Ingham St
- 4921 Ingham St
- 4906 Ingham St
- 4912 Ingham St
- 4927 Ingham St
- 4920 Ingham St
- 4815 Ingham St
- 4809 Ingham St
- 5011 Ingham St
- 4930 Ingham St
- 5004 Ingham St
- 4808 Ingham St
- 5010 Ingham St
- 5017 Ingham St
- 2706 W Jolly Rd
- 5016 Ingham St
- 4926 Sidney St
- 4727 Ingham St
- 4726 Ingham St