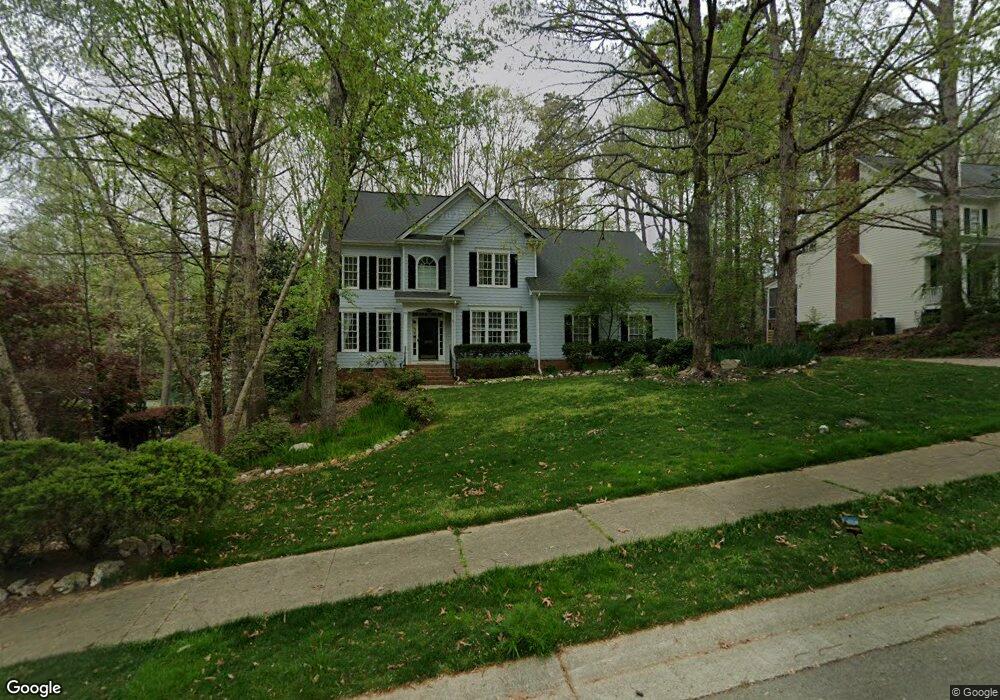
4909 Timbergreen Ln Holly Springs, NC 27540
Estimated Value: $619,000 - $761,000
4
Beds
3
Baths
3,300
Sq Ft
$209/Sq Ft
Est. Value
About This Home
This home is located at 4909 Timbergreen Ln, Holly Springs, NC 27540 and is currently estimated at $688,869, approximately $208 per square foot. 4909 Timbergreen Ln is a home located in Wake County with nearby schools including Holly Ridge Elementary School, Holly Ridge Middle School, and Holly Springs High School.
Ownership History
Date
Name
Owned For
Owner Type
Purchase Details
Closed on
Jul 27, 2004
Sold by
Cendant Mobility Government Financial Se
Bought by
Schneider Robert J and Schneider Kelli J
Current Estimated Value
Home Financials for this Owner
Home Financials are based on the most recent Mortgage that was taken out on this home.
Original Mortgage
$155,000
Interest Rate
5.97%
Mortgage Type
Purchase Money Mortgage
Purchase Details
Closed on
Jun 15, 2004
Sold by
Mcguire Shirley M and Mcguire George T
Bought by
Cendant Mobility Government Financial Se
Home Financials for this Owner
Home Financials are based on the most recent Mortgage that was taken out on this home.
Original Mortgage
$155,000
Interest Rate
5.97%
Mortgage Type
Purchase Money Mortgage
Purchase Details
Closed on
Aug 3, 2001
Sold by
Masecar Robert R and Masecar Barbara L
Bought by
Mcguire George T and Mcguire Shirley M
Home Financials for this Owner
Home Financials are based on the most recent Mortgage that was taken out on this home.
Original Mortgage
$125,000
Interest Rate
7.09%
Mortgage Type
Balloon
Purchase Details
Closed on
Jun 23, 2000
Sold by
Moore Robert P
Bought by
Masecar Robert R and Masecar Barbara L
Create a Home Valuation Report for This Property
The Home Valuation Report is an in-depth analysis detailing your home's value as well as a comparison with similar homes in the area
Home Values in the Area
Average Home Value in this Area
Purchase History
| Date | Buyer | Sale Price | Title Company |
|---|---|---|---|
| Schneider Robert J | $287,000 | -- | |
| Cendant Mobility Government Financial Se | $287,000 | -- | |
| Mcguire George T | $271,000 | -- | |
| Masecar Robert R | $71,000 | -- |
Source: Public Records
Mortgage History
| Date | Status | Borrower | Loan Amount |
|---|---|---|---|
| Closed | Schneider Robert J | $155,000 | |
| Previous Owner | Mcguire George T | $125,000 |
Source: Public Records
Tax History Compared to Growth
Tax History
| Year | Tax Paid | Tax Assessment Tax Assessment Total Assessment is a certain percentage of the fair market value that is determined by local assessors to be the total taxable value of land and additions on the property. | Land | Improvement |
|---|---|---|---|---|
| 2025 | $5,543 | $641,730 | $155,000 | $486,730 |
| 2024 | $5,520 | $641,730 | $155,000 | $486,730 |
| 2023 | $4,294 | $396,269 | $64,000 | $332,269 |
| 2022 | $4,146 | $396,269 | $64,000 | $332,269 |
| 2021 | $4,068 | $396,269 | $64,000 | $332,269 |
| 2020 | $4,068 | $396,269 | $64,000 | $332,269 |
| 2019 | $4,057 | $335,517 | $64,000 | $271,517 |
| 2018 | $3,667 | $335,517 | $64,000 | $271,517 |
| 2017 | $3,535 | $335,517 | $64,000 | $271,517 |
| 2016 | $3,486 | $335,517 | $64,000 | $271,517 |
| 2015 | $3,813 | $361,432 | $90,000 | $271,432 |
| 2014 | $3,681 | $361,432 | $90,000 | $271,432 |
Source: Public Records
Map
Nearby Homes
- 5200 Gable Ridge Ln
- 404 Prince Dr
- 504 Prince Dr
- 137 Lacombe Ct
- 109 Lacombe Ct
- 717 Bass Lake Rd
- 0/416 Holly Springs Rd
- 144 Holly Mountain Rd
- 705 Morton Farm Rd
- 215 Savannah Ridge Rd Unit 215
- 4809 Greenpoint Ln
- 305 Savannah Ridge Rd
- 1108 Braswell Creek Point
- 225 Old Ride Dr
- 208 Old Ride Dr
- 217 Jones Hill Rd
- 5309 Shoreline Ct
- 228 Masden Rd
- 413 Rhamkatte Rd
- 204 Crossway Ln
- 4913 Timbergreen Ln
- 4905 Timbergreen Ln
- 5208 Sunset Walk Ln
- 5212 Sunset Walk Ln
- 5204 Sunset Walk Ln
- 4916 Timbergreen Ln
- 4917 Timbergreen Ln
- 4912 Timbergreen Ln
- 5200 Sunset Walk Ln
- 4920 Timbergreen Ln
- 5216 Sunset Walk Ln
- 4908 Timbergreen Ln
- 4924 Timbergreen Ln
- 4921 Timbergreen Ln
- 4904 Timbergreen Ln
- 78 Woodland Path
- 5220 Sunset Walk Ln
- 216 Norwalk St
- 212 Norwalk St
- 5112 Sunset Walk Ln