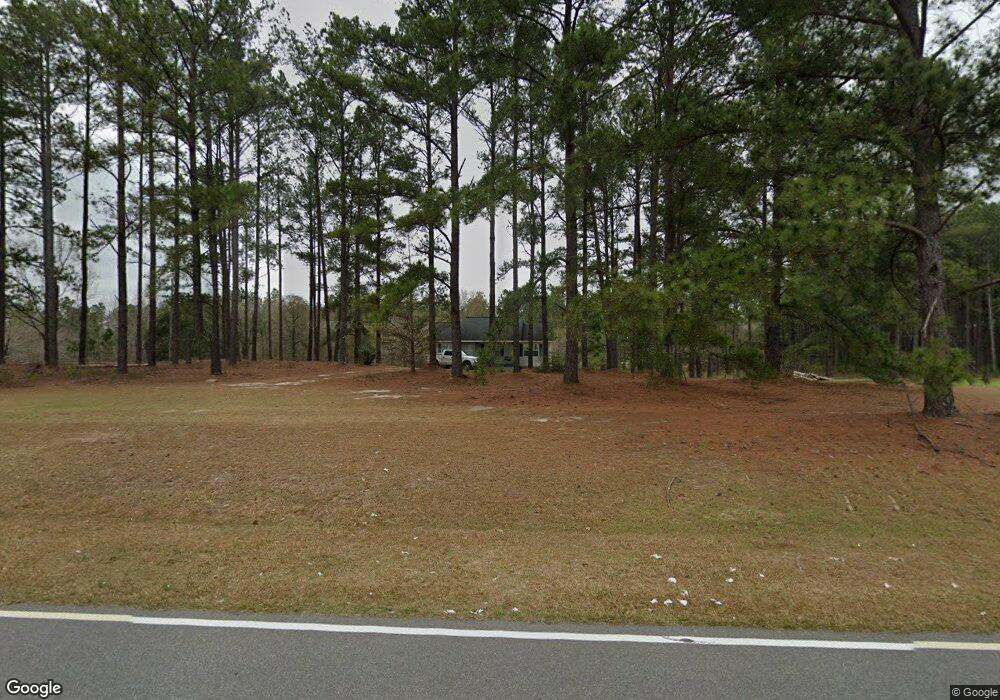
491 Frank Cook Rd Cochran, GA 31014
Estimated Value: $144,000 - $165,000
2
Beds
2
Baths
1,260
Sq Ft
$124/Sq Ft
Est. Value
About This Home
This home is located at 491 Frank Cook Rd, Cochran, GA 31014 and is currently estimated at $156,015, approximately $123 per square foot. 491 Frank Cook Rd is a home located in Bleckley County with nearby schools including Bleckley County Primary School, Bleckley County Elementary School, and Bleckley Middle School.
Ownership History
Date
Name
Owned For
Owner Type
Purchase Details
Closed on
Dec 29, 2020
Sold by
Reagan Jeffery
Bought by
Colston James Emory
Current Estimated Value
Purchase Details
Closed on
Feb 4, 2010
Sold by
Register Ross I
Bought by
Reagan Jeffery and Reagan Tina
Purchase Details
Closed on
Oct 3, 2006
Sold by
Register Deborah S
Bought by
Register Ross I
Purchase Details
Closed on
Apr 7, 1995
Bought by
Register Ross I
Create a Home Valuation Report for This Property
The Home Valuation Report is an in-depth analysis detailing your home's value as well as a comparison with similar homes in the area
Home Values in the Area
Average Home Value in this Area
Purchase History
| Date | Buyer | Sale Price | Title Company |
|---|---|---|---|
| Colston James Emory | $75,000 | -- | |
| Reagan Jeffery | $62,000 | -- | |
| Register Ross I | -- | -- | |
| Register Ross I | $4,100 | -- |
Source: Public Records
Tax History Compared to Growth
Tax History
| Year | Tax Paid | Tax Assessment Tax Assessment Total Assessment is a certain percentage of the fair market value that is determined by local assessors to be the total taxable value of land and additions on the property. | Land | Improvement |
|---|---|---|---|---|
| 2024 | $1,199 | $44,840 | $2,680 | $42,160 |
| 2023 | $1,244 | $44,840 | $2,680 | $42,160 |
| 2022 | $1,088 | $40,000 | $2,680 | $37,320 |
| 2021 | $874 | $30,120 | $2,120 | $28,000 |
| 2020 | $877 | $30,120 | $2,120 | $28,000 |
| 2019 | $825 | $28,294 | $2,339 | $25,955 |
| 2018 | $832 | $28,294 | $2,339 | $25,955 |
| 2017 | $831 | $28,294 | $2,339 | $25,955 |
| 2016 | $832 | $28,294 | $2,339 | $25,955 |
| 2015 | -- | $28,294 | $2,339 | $25,955 |
| 2014 | -- | $28,294 | $2,339 | $25,955 |
| 2013 | -- | $28,294 | $2,339 | $25,955 |
Source: Public Records
Map
Nearby Homes
- 0 Rock Hill Rd
- 166 Pebble Hills Rd
- 176 Pineland Estates Rd
- 238 Wood Oak Cir
- 288 Frank Cook Rd
- 0 Wood Oak Cir Unit 233873
- 0 Wood Oak Cir Unit 9278951
- Lots Crest Dr
- LAND Crest Dr
- 319 Country Club Rd
- 150 Wood Oak Cir
- 124 Pine Hill Dr
- 264 Ann St
- 260 Ann St
- 157 10th St SE
- 110 Chestnut Dr
- 178 Country Club Cir
- 105 Hillcrest Dr
- 10 Timber Way
- 7 Evergreen Dr
- 474 Frank Cook Rd
- 111 Pineland Estates Rd
- 170 Bennett Rd
- 523 Frank Cook Rd
- 460 Frank Cook Rd
- 453 Frank Cook Rd
- 439 Frank Cook Rd
- 172 Rock Hill Rd
- 440 Frank Cook Rd
- 138 Pineland Estates Rd
- 141 Pineland Estates Rd
- 421 Frank Cook Rd
- 151 Pineland Estates Rd
- 179 Rock Hill Rd
- 147 Rock Hill Rd
- 111 Bennett Rd
- 183 Rock Hill Rd
- 164 Pineland Estates Rd
- 222 Nesmith Rd
- 161 Pineland Estates Rd