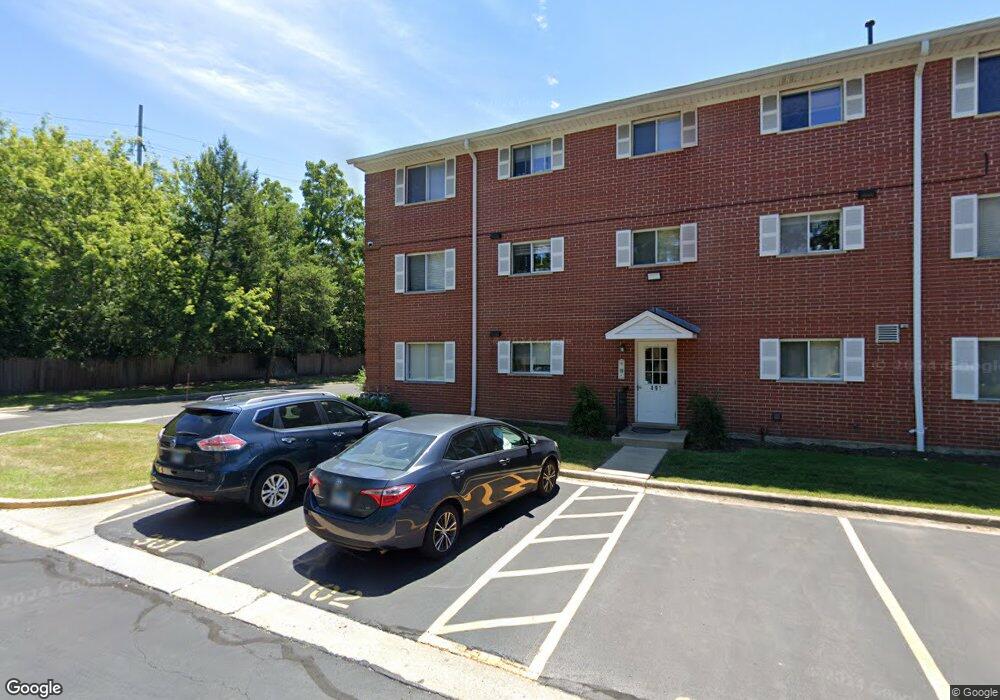
491 Leslie Ct Unit 202 Des Plaines, IL 60016
Forest River NeighborhoodEstimated Value: $218,000 - $337,000
2
Beds
2
Baths
972
Sq Ft
$263/Sq Ft
Est. Value
About This Home
This home is located at 491 Leslie Ct Unit 202, Des Plaines, IL 60016 and is currently estimated at $255,595, approximately $262 per square foot. 491 Leslie Ct Unit 202 is a home located in Cook County with nearby schools including North Elementary School, Chippewa Middle School, and Maine East High School.
Ownership History
Date
Name
Owned For
Owner Type
Purchase Details
Closed on
Oct 4, 2017
Sold by
North Shore Holdings Ltd
Bought by
Lupian Rosa L Contreras and Tang Armando J
Current Estimated Value
Home Financials for this Owner
Home Financials are based on the most recent Mortgage that was taken out on this home.
Original Mortgage
$109,250
Outstanding Balance
$92,868
Interest Rate
4.5%
Mortgage Type
New Conventional
Estimated Equity
$162,727
Purchase Details
Closed on
Feb 8, 2017
Sold by
Tianeva
Bought by
North Shore Holdings Ltd
Purchase Details
Closed on
Jun 26, 2002
Sold by
Grabska Teresa
Bought by
Tianeva Dimka
Home Financials for this Owner
Home Financials are based on the most recent Mortgage that was taken out on this home.
Original Mortgage
$137,750
Interest Rate
6.93%
Purchase Details
Closed on
Oct 18, 1994
Sold by
Lasalle National Trust Na
Bought by
The Conrad Family Revocable Living Trust
Create a Home Valuation Report for This Property
The Home Valuation Report is an in-depth analysis detailing your home's value as well as a comparison with similar homes in the area
Home Values in the Area
Average Home Value in this Area
Purchase History
| Date | Buyer | Sale Price | Title Company |
|---|---|---|---|
| Lupian Rosa L Contreras | $115,000 | Saturn Title Llc | |
| North Shore Holdings Ltd | $85,000 | None Available | |
| Tianeva Dimka | $145,000 | -- | |
| The Conrad Family Revocable Living Trust | -- | -- |
Source: Public Records
Mortgage History
| Date | Status | Borrower | Loan Amount |
|---|---|---|---|
| Open | Lupian Rosa L Contreras | $109,250 | |
| Previous Owner | Tianeva Dimka | $137,750 |
Source: Public Records
Tax History Compared to Growth
Tax History
| Year | Tax Paid | Tax Assessment Tax Assessment Total Assessment is a certain percentage of the fair market value that is determined by local assessors to be the total taxable value of land and additions on the property. | Land | Improvement |
|---|---|---|---|---|
| 2024 | $2,655 | $13,334 | $365 | $12,969 |
| 2023 | $2,528 | $13,334 | $365 | $12,969 |
| 2022 | $2,528 | $13,334 | $365 | $12,969 |
| 2021 | $3,148 | $10,233 | $443 | $9,790 |
| 2020 | $3,091 | $10,233 | $443 | $9,790 |
| 2019 | $3,057 | $11,477 | $443 | $11,034 |
| 2018 | $3,151 | $10,451 | $391 | $10,060 |
| 2017 | $2,105 | $10,451 | $391 | $10,060 |
| 2016 | $2,222 | $10,451 | $391 | $10,060 |
| 2015 | $3,100 | $12,824 | $338 | $12,486 |
| 2014 | $3,027 | $12,824 | $338 | $12,486 |
| 2013 | $2,932 | $12,824 | $338 | $12,486 |
Source: Public Records
Map
Nearby Homes
- 206 Country Ln Unit 206
- 9525 W Oak Place
- 9517 W Central Rd
- 225 N East River Rd
- 9600 S Lyman Ave
- 10151 Meadow Ln
- 183 N East River Rd Unit F-4
- 183 N East River Rd Unit D-3
- 183 N East River Rd Unit C1
- 186 E River Rd
- 184 E River Rd
- 182 E River Rd
- 9630 Reding Cir
- 180 N East River Rd
- 9411 Harrison St Unit 471494
- 9330 Hamilton Ct Unit E
- 3615 E Central Rd Unit 101
- 9821 Bianco Terrace Unit A
- 4170 Cove Ln Unit 2B
- 9454 Meadow Ln
- 491 Leslie Ct Unit 302
- 491 Leslie Ct Unit 201
- 491 Leslie Ct Unit 102
- 491 Leslie Ct Unit 301
- 491 Leslie Ct Unit 101
- 491 Leslie Ct
- 493 Leslie Ct Unit 301
- 489 Leslie Ct Unit 102
- 489 Leslie Ct Unit 201
- 489 Leslie Ct Unit 101
- 489 Leslie Ct Unit 202
- 489 Leslie Ct Unit 302
- 489 Leslie Ct Unit 301
- 208 Country Ln Unit 208
- 302 Country Ln Unit 302
- 207 Country Ln Unit 207
- 205 Country Ln Unit 205
- 304 Country Ln Unit 304
- 301 Country Ln Unit 301
- 303 Country Ln Unit 303