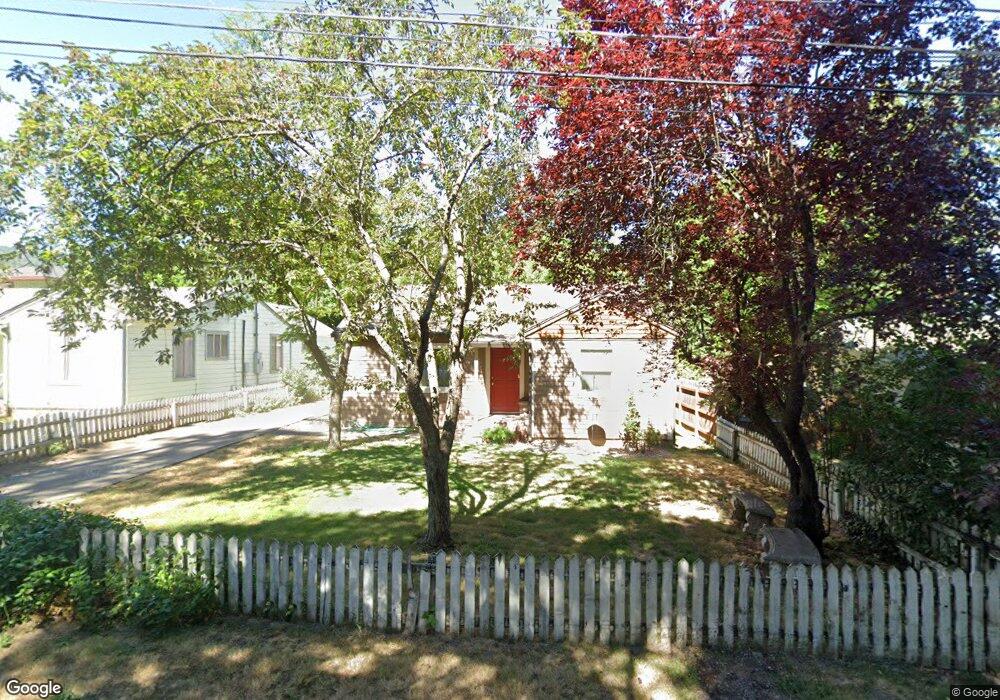
491 Normal Ave Ashland, OR 97520
South Ashland NeighborhoodEstimated Value: $394,000 - $475,000
3
Beds
1
Bath
1,234
Sq Ft
$344/Sq Ft
Est. Value
About This Home
This home is located at 491 Normal Ave, Ashland, OR 97520 and is currently estimated at $425,098, approximately $344 per square foot. 491 Normal Ave is a home located in Jackson County with nearby schools including Walker Elementary School, Ashland Middle School, and Ashland High School.
Ownership History
Date
Name
Owned For
Owner Type
Purchase Details
Closed on
Oct 30, 2025
Sold by
Almaguer John A and Alvarez Alma R
Bought by
Alma Rosa Alvarez-Almaguer and Alma John Almaguer
Current Estimated Value
Purchase Details
Closed on
Nov 11, 2004
Sold by
Fulton Richard F B and Fulton Celine F B
Bought by
Almaguer John A and Alvarez Alma R
Home Financials for this Owner
Home Financials are based on the most recent Mortgage that was taken out on this home.
Original Mortgage
$295,000
Interest Rate
5.7%
Mortgage Type
New Conventional
Purchase Details
Closed on
May 27, 2004
Sold by
Busse Rodger E and Busse Patricia A
Bought by
Fulton Richard F B and Fulton Celine F B
Home Financials for this Owner
Home Financials are based on the most recent Mortgage that was taken out on this home.
Original Mortgage
$191,200
Interest Rate
4.75%
Mortgage Type
Purchase Money Mortgage
Purchase Details
Closed on
Dec 22, 2000
Sold by
Dickey Robert R and Dickey Alison G
Bought by
Busse Rodger E and Busse Patricia A
Home Financials for this Owner
Home Financials are based on the most recent Mortgage that was taken out on this home.
Original Mortgage
$132,000
Interest Rate
7.71%
Create a Home Valuation Report for This Property
The Home Valuation Report is an in-depth analysis detailing your home's value as well as a comparison with similar homes in the area
Home Values in the Area
Average Home Value in this Area
Purchase History
| Date | Buyer | Sale Price | Title Company |
|---|---|---|---|
| Alma Rosa Alvarez-Almaguer | -- | None Listed On Document | |
| Alvarez-Almaguer Alma Rosa | -- | None Listed On Document | |
| Almaguer John A | $295,000 | Lawyers Title Ins | |
| Fulton Richard F B | $239,000 | Lawyers Title Ins | |
| Busse Rodger E | $165,000 | Crater Title Insurance |
Source: Public Records
Mortgage History
| Date | Status | Borrower | Loan Amount |
|---|---|---|---|
| Previous Owner | Almaguer John A | $295,000 | |
| Previous Owner | Fulton Richard F B | $191,200 | |
| Previous Owner | Busse Rodger E | $132,000 | |
| Closed | Busse Rodger E | $13,000 |
Source: Public Records
Tax History
| Year | Tax Paid | Tax Assessment Tax Assessment Total Assessment is a certain percentage of the fair market value that is determined by local assessors to be the total taxable value of land and additions on the property. | Land | Improvement |
|---|---|---|---|---|
| 2026 | $4,229 | $255,910 | $183,000 | $72,910 |
| 2025 | $4,140 | $267,010 | $149,640 | $117,370 |
| 2024 | $4,140 | $259,240 | $145,280 | $113,960 |
| 2023 | $4,005 | $251,690 | $141,050 | $110,640 |
| 2022 | $3,877 | $251,690 | $141,050 | $110,640 |
| 2021 | $3,745 | $244,360 | $136,940 | $107,420 |
| 2020 | $3,639 | $237,250 | $132,960 | $104,290 |
| 2019 | $3,582 | $223,640 | $125,340 | $98,300 |
| 2018 | $3,384 | $217,130 | $121,690 | $95,440 |
| 2017 | $3,359 | $217,130 | $121,690 | $95,440 |
| 2016 | $3,272 | $204,670 | $114,710 | $89,960 |
| 2015 | $3,145 | $204,670 | $114,710 | $89,960 |
| 2014 | $2,946 | $192,930 | $108,130 | $84,800 |
Source: Public Records
Map
Nearby Homes
- 321 Clay St Unit SPC 3
- 740 Park St
- 780 Oakway Cir
- 790 Park St Unit 796
- 262 Meadow Dr
- 267 Meadow Dr
- 794 Park St Unit 794
- 369 Meadow Dr
- 802 Park St Unit 802
- 843 Hillview Dr
- 235 Meadow Dr
- 736 Frances Ln
- 0 Oregon 66 Unit 220203024
- 2205 Ashland St Unit 210
- 2221 Dollarhide Way
- 2684 Clay Creek Way
- 965 Park St
- 968 Garden Way
- 295 Tolman Creek Rd Unit 1
- 2729 Clay Creek Way
Your Personal Tour Guide
Ask me questions while you tour the home.