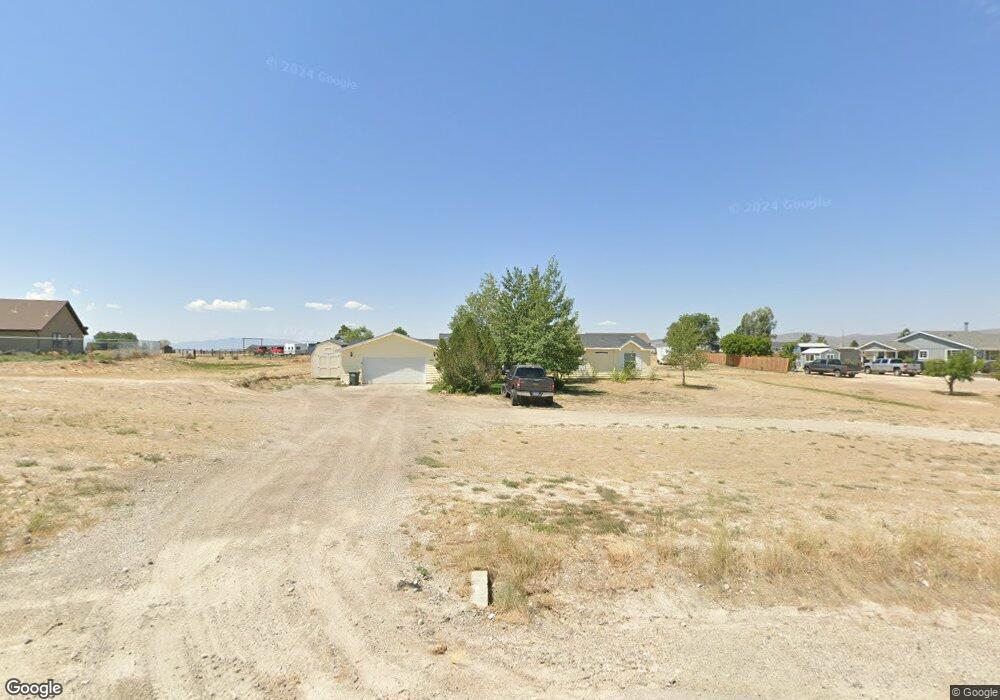
491 Rawlings Dr Spring Creek, NV 89815
Estimated Value: $348,000 - $402,000
Studio
--
Bath
1,788
Sq Ft
$212/Sq Ft
Est. Value
About This Home
This home is located at 491 Rawlings Dr, Spring Creek, NV 89815 and is currently estimated at $378,345, approximately $211 per square foot. 491 Rawlings Dr is a home located in Elko County with nearby schools including Spring Creek Elementary School, Spring Creek Middle School, and Spring Creek High School.
Ownership History
Date
Name
Owned For
Owner Type
Purchase Details
Closed on
May 16, 2017
Sold by
Sant Creon D and Christine Sant M
Bought by
Larrinaga John R and Larrinaga Amanda K
Current Estimated Value
Home Financials for this Owner
Home Financials are based on the most recent Mortgage that was taken out on this home.
Original Mortgage
$206,196
Outstanding Balance
$171,737
Interest Rate
4.5%
Mortgage Type
FHA
Estimated Equity
$206,608
Purchase Details
Closed on
Nov 1, 2006
Sold by
Sant Creon and Christine Sant M
Bought by
Sant Creon D and Christine Sant M
Home Financials for this Owner
Home Financials are based on the most recent Mortgage that was taken out on this home.
Original Mortgage
$157,000
Interest Rate
6.36%
Mortgage Type
New Conventional
Purchase Details
Closed on
Aug 24, 2005
Sold by
Tsugawa Ernest Hiroshi
Bought by
Sant Creon and Christine Sant M
Create a Home Valuation Report for This Property
The Home Valuation Report is an in-depth analysis detailing your home's value as well as a comparison with similar homes in the area
Purchase History
| Date | Buyer | Sale Price | Title Company |
|---|---|---|---|
| Larrinaga John R | $210,000 | Stewart Title Elko | |
| Sant Creon D | -- | Stewart Title | |
| Sant Creon | $9,000 | Stewart Title |
Source: Public Records
Mortgage History
| Date | Status | Borrower | Loan Amount |
|---|---|---|---|
| Open | Larrinaga John R | $206,196 | |
| Previous Owner | Sant Creon D | $157,000 |
Source: Public Records
Tax History
| Year | Tax Paid | Tax Assessment Tax Assessment Total Assessment is a certain percentage of the fair market value that is determined by local assessors to be the total taxable value of land and additions on the property. | Land | Improvement |
|---|---|---|---|---|
| 2025 | $2,356 | $95,192 | $17,500 | $77,692 |
| 2024 | $2,356 | $96,209 | $17,500 | $78,709 |
| 2023 | $2,101 | $90,664 | $16,800 | $73,864 |
| 2022 | $2,040 | $79,341 | $16,800 | $62,541 |
| 2021 | $1,980 | $77,839 | $16,800 | $61,039 |
| 2020 | $1,922 | $78,483 | $16,800 | $61,683 |
| 2019 | $1,866 | $66,064 | $7,700 | $58,364 |
| 2018 | $1,869 | $66,420 | $7,700 | $58,720 |
| 2017 | $1,673 | $65,196 | $7,700 | $57,496 |
| 2016 | $1,676 | $64,678 | $7,700 | $56,978 |
| 2015 | $1,640 | $63,854 | $7,700 | $56,154 |
| 2014 | $1,594 | $61,117 | $7,700 | $53,417 |
Source: Public Records
Map
Nearby Homes
- 518 Shadybrook Dr
- 522 Shadybrook Dr
- 0 006-30c-040 Unit 3627457
- 630 Shadybrook Dr
- 501 Gary's Way
- 747 Pioneer Way
- 4 Licht Pkwy
- 0 Lamoille Hwy
- 277 Glenvista Dr
- 262 Glenvista Dr
- 384 Valley Bend Dr
- 229 Glenvista Dr
- 491 Blakeland Dr
- 386 Flora Dr
- 217 Blakeland Dr
- 135 Glenvista Dr
- 774 Arroyo Vista Dr
- 233 Trentwood Dr
- 117 Glenvista Dr
- 510 Poplar Dr
Your Personal Tour Guide
Ask me questions while you tour the home.