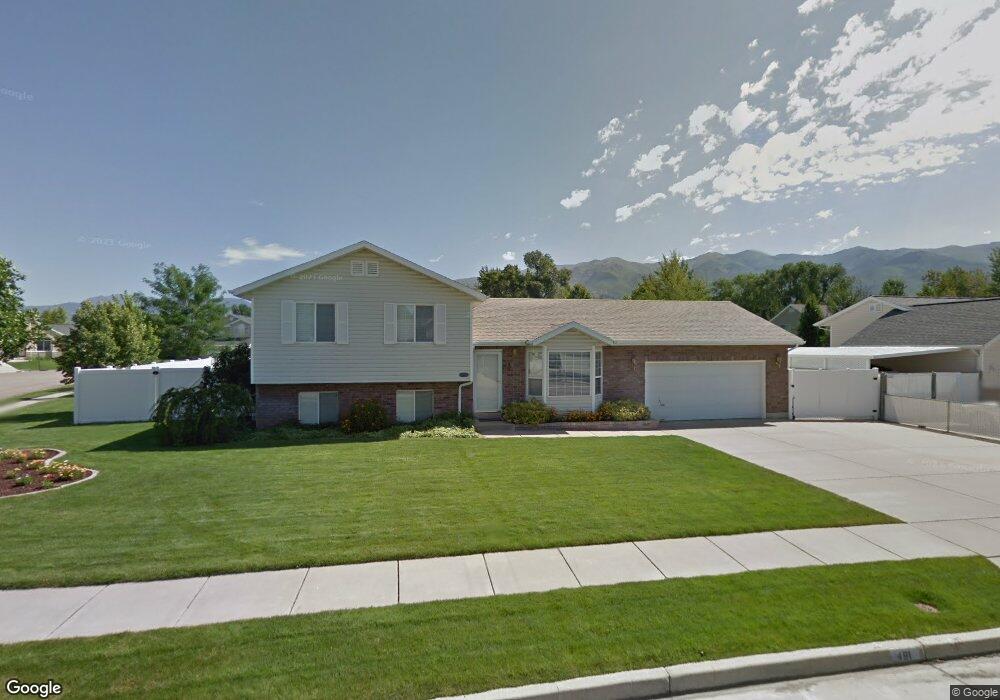
491 S 755 E Layton, UT 84041
Estimated Value: $474,453 - $526,000
4
Beds
3
Baths
1,717
Sq Ft
$292/Sq Ft
Est. Value
About This Home
This home is located at 491 S 755 E, Layton, UT 84041 and is currently estimated at $501,613, approximately $292 per square foot. 491 S 755 E is a home located in Davis County with nearby schools including Whitesides Elementary School, Fairfield Junior High School, and Layton High School.
Ownership History
Date
Name
Owned For
Owner Type
Purchase Details
Closed on
Oct 30, 2014
Sold by
Scilley Michael D and Scilley Stephanie L
Bought by
Amer Homes 4 Rent Properties Nine Llc
Current Estimated Value
Purchase Details
Closed on
Apr 26, 2011
Sold by
Faulkner Courtney B and Faulkner Summer L
Bought by
Scilley Michael D and Scilley Stephanie L
Home Financials for this Owner
Home Financials are based on the most recent Mortgage that was taken out on this home.
Original Mortgage
$10,409
Interest Rate
4.84%
Mortgage Type
Stand Alone Second
Purchase Details
Closed on
May 2, 2001
Sold by
Faulkner Nicholas L and Faulkner Nancy
Bought by
Faulkner Courtney B and Faulkner Summer L
Purchase Details
Closed on
Nov 19, 1996
Sold by
Moran Linda
Bought by
Faulkner Nicholas L and Faulkner Nancy
Home Financials for this Owner
Home Financials are based on the most recent Mortgage that was taken out on this home.
Original Mortgage
$116,900
Interest Rate
7.86%
Create a Home Valuation Report for This Property
The Home Valuation Report is an in-depth analysis detailing your home's value as well as a comparison with similar homes in the area
Home Values in the Area
Average Home Value in this Area
Purchase History
| Date | Buyer | Sale Price | Title Company |
|---|---|---|---|
| Amer Homes 4 Rent Properties Nine Llc | -- | Inwest Title Servic | |
| Scilley Michael D | -- | Founders Title Co L | |
| Faulkner Courtney B | -- | Inwest Title Services Inc | |
| Faulkner Nicholas L | -- | Founders Title Company |
Source: Public Records
Mortgage History
| Date | Status | Borrower | Loan Amount |
|---|---|---|---|
| Previous Owner | Scilley Michael D | $10,409 | |
| Previous Owner | Scilley Michael D | $173,487 | |
| Previous Owner | Faulkner Nicholas L | $116,900 |
Source: Public Records
Tax History
| Year | Tax Paid | Tax Assessment Tax Assessment Total Assessment is a certain percentage of the fair market value that is determined by local assessors to be the total taxable value of land and additions on the property. | Land | Improvement |
|---|---|---|---|---|
| 2025 | $2,248 | $235,950 | $106,128 | $129,822 |
| 2024 | $2,153 | $227,699 | $123,082 | $104,617 |
| 2023 | $2,184 | $223,850 | $77,594 | $146,256 |
| 2022 | $2,255 | $415,000 | $138,444 | $276,556 |
| 2021 | $2,127 | $321,000 | $111,041 | $209,959 |
| 2020 | $1,920 | $278,000 | $91,635 | $186,365 |
| 2019 | $1,868 | $265,000 | $85,426 | $179,574 |
| 2018 | $1,700 | $242,000 | $85,426 | $156,574 |
| 2016 | $1,603 | $117,755 | $28,447 | $89,308 |
| 2015 | $1,557 | $108,570 | $28,447 | $80,123 |
| 2014 | $1,659 | $118,264 | $28,447 | $89,817 |
| 2013 | -- | $96,751 | $24,816 | $71,935 |
Source: Public Records
Map
Nearby Homes
- 617 E 405 S
- 504 E Alice Way
- 679 S Clearwater Falls Dr
- 464 E Alice Way
- 706 S 600 E
- 389 Morgan St
- 811 S Main St
- 623 E Clearwater Dr Unit 15
- 772 N Crimson Ln
- 680 N Main St Trlr E-11
- 86 Mill Rd
- 895 S Main St Unit E
- 905 S Main St Unit G
- 917 S Main St Unit H
- 282 E 925 S
- 948 S 250 E
- 9 Colonial Ave
- 949 S 225 E
- 766 N Stonne Ln
- 680 N Main St Unit B13
Your Personal Tour Guide
Ask me questions while you tour the home.