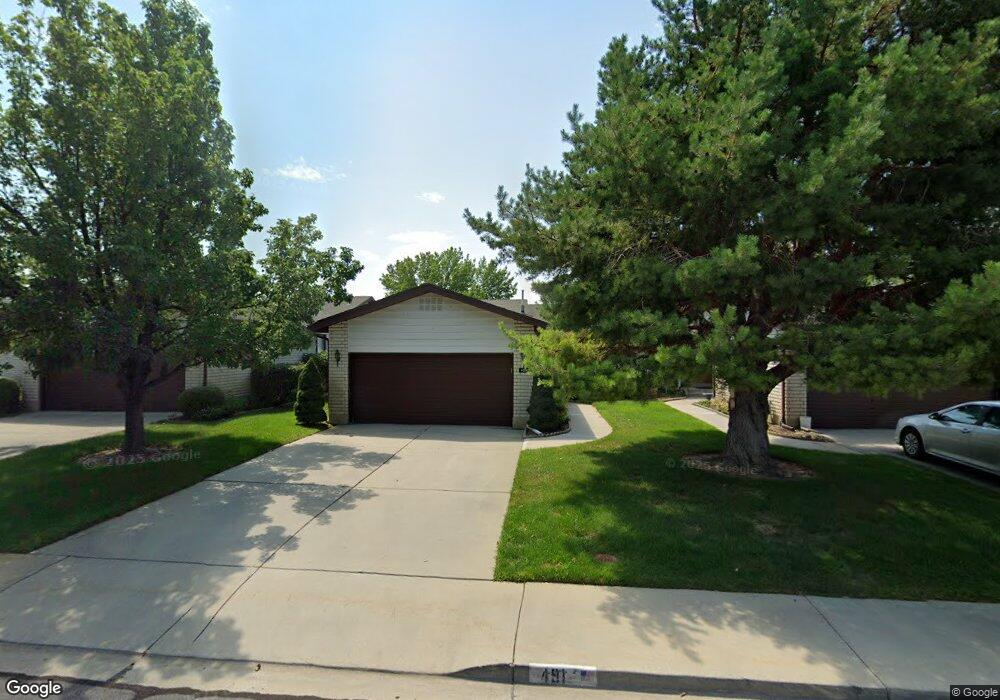
491 W 120 N Orem, UT 84057
Suncrest NeighborhoodEstimated Value: $431,000 - $464,607
4
Beds
3
Baths
2,642
Sq Ft
$170/Sq Ft
Est. Value
About This Home
This home is located at 491 W 120 N, Orem, UT 84057 and is currently estimated at $450,152, approximately $170 per square foot. 491 W 120 N is a home located in Utah County with nearby schools including Parkside Elementary School, Orem Junior High School, and Mountain View High School.
Ownership History
Date
Name
Owned For
Owner Type
Purchase Details
Closed on
Nov 28, 2023
Sold by
Genevieve Frei Trust
Bought by
Genevieve Frei Trust and Frei
Current Estimated Value
Purchase Details
Closed on
May 21, 2020
Sold by
Frei Genevieve and Frei Randal M
Bought by
Frei Genevieve and Frei Randal
Purchase Details
Closed on
Jan 4, 2016
Sold by
Frei Genevieve
Bought by
Frie Genevieve and Frei Randal M
Purchase Details
Closed on
Dec 30, 2015
Sold by
Blomquist Lori
Bought by
Frei Genevieve
Purchase Details
Closed on
Nov 1, 2012
Sold by
Nilsen Louis
Bought by
Nilsen Lois and Lois Nilsen Trust
Purchase Details
Closed on
Nov 15, 2010
Sold by
Smith Linda Lee
Bought by
Nilsen Kenneth R and Nilsen Lois
Home Financials for this Owner
Home Financials are based on the most recent Mortgage that was taken out on this home.
Original Mortgage
$104,000
Interest Rate
4.16%
Mortgage Type
New Conventional
Purchase Details
Closed on
Oct 18, 1996
Sold by
Murdock Elza W
Bought by
Murdock Elza W and Smith Linda Lee
Create a Home Valuation Report for This Property
The Home Valuation Report is an in-depth analysis detailing your home's value as well as a comparison with similar homes in the area
Home Values in the Area
Average Home Value in this Area
Purchase History
| Date | Buyer | Sale Price | Title Company |
|---|---|---|---|
| Genevieve Frei Trust | -- | None Listed On Document | |
| Frei Genevieve | -- | None Available | |
| Frie Genevieve | -- | Us Title Insurance Agency | |
| Frei Genevieve | -- | Us Title Insurance Agency | |
| Nilsen Lois | -- | None Available | |
| Nilsen Kenneth R | -- | Utah First Title Insurance | |
| Murdock Elza W | -- | -- |
Source: Public Records
Mortgage History
| Date | Status | Borrower | Loan Amount |
|---|---|---|---|
| Previous Owner | Nilsen Kenneth R | $104,000 |
Source: Public Records
Tax History Compared to Growth
Tax History
| Year | Tax Paid | Tax Assessment Tax Assessment Total Assessment is a certain percentage of the fair market value that is determined by local assessors to be the total taxable value of land and additions on the property. | Land | Improvement |
|---|---|---|---|---|
| 2025 | $1,910 | $226,930 | $60,700 | $351,900 |
| 2024 | $1,910 | $233,585 | $0 | $0 |
| 2023 | $1,749 | $229,900 | $0 | $0 |
| 2022 | $1,738 | $221,320 | $0 | $0 |
| 2021 | $1,637 | $315,600 | $37,900 | $277,700 |
| 2020 | $1,487 | $281,800 | $33,800 | $248,000 |
| 2019 | $1,375 | $271,000 | $35,200 | $235,800 |
| 2018 | $1,320 | $248,600 | $30,000 | $218,600 |
| 2017 | $1,179 | $118,910 | $0 | $0 |
| 2016 | $1,112 | $103,400 | $0 | $0 |
| 2015 | $1,175 | $103,400 | $0 | $0 |
| 2014 | $1,055 | $92,400 | $0 | $0 |
Source: Public Records
Map
Nearby Homes