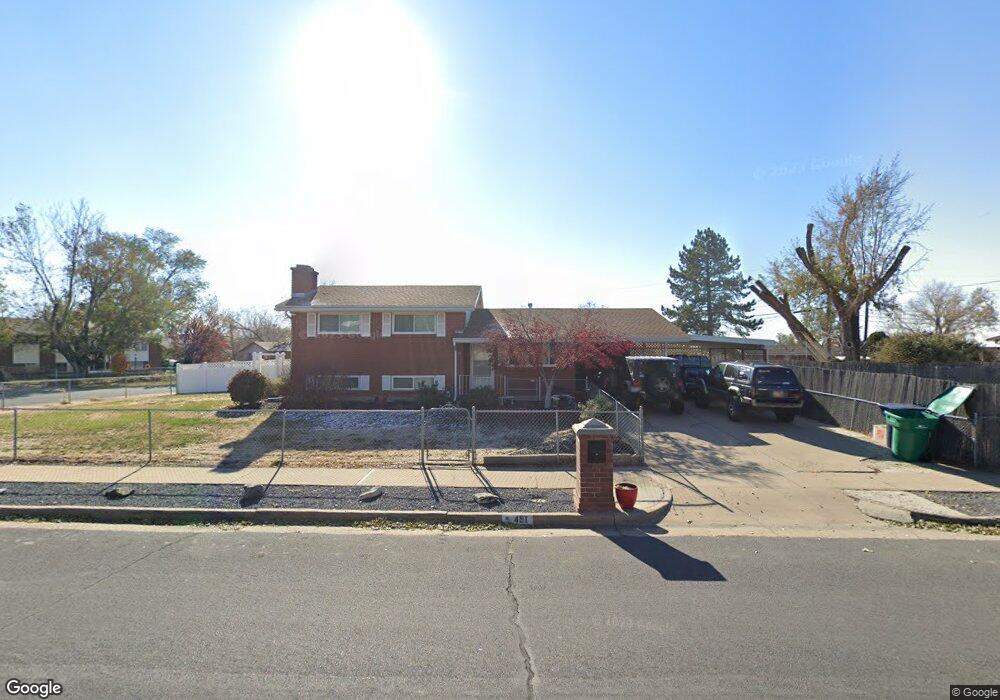
491 W 2475 N Layton, UT 84041
Estimated Value: $403,000 - $421,000
4
Beds
2
Baths
1,118
Sq Ft
$371/Sq Ft
Est. Value
About This Home
This home is located at 491 W 2475 N, Layton, UT 84041 and is currently estimated at $414,906, approximately $371 per square foot. 491 W 2475 N is a home located in Davis County with nearby schools including Lincoln Elementary School, North Layton Junior High School, and Northridge High School.
Ownership History
Date
Name
Owned For
Owner Type
Purchase Details
Closed on
Apr 9, 2018
Sold by
Larsen Linda D
Bought by
Tracy Stefanie V
Current Estimated Value
Home Financials for this Owner
Home Financials are based on the most recent Mortgage that was taken out on this home.
Original Mortgage
$127,000
Outstanding Balance
$108,880
Interest Rate
4.4%
Mortgage Type
New Conventional
Estimated Equity
$306,026
Purchase Details
Closed on
Sep 14, 2017
Sold by
Larsen Linda D
Bought by
Larsen Christian Lyal and Larsen Linda
Purchase Details
Closed on
Mar 25, 2011
Sold by
Peterson Karoline Marianne and Helquist David M
Bought by
Larsen Christian Lyal
Home Financials for this Owner
Home Financials are based on the most recent Mortgage that was taken out on this home.
Original Mortgage
$3,798
Interest Rate
4.9%
Mortgage Type
Stand Alone Second
Create a Home Valuation Report for This Property
The Home Valuation Report is an in-depth analysis detailing your home's value as well as a comparison with similar homes in the area
Home Values in the Area
Average Home Value in this Area
Purchase History
| Date | Buyer | Sale Price | Title Company |
|---|---|---|---|
| Tracy Stefanie V | -- | None Available | |
| Larsen Christian Lyal | -- | -- | |
| Larsen Christian Lyal | -- | Backman Title Services |
Source: Public Records
Mortgage History
| Date | Status | Borrower | Loan Amount |
|---|---|---|---|
| Open | Tracy Stefanie V | $127,000 | |
| Previous Owner | Larsen Christian Lyal | $3,798 | |
| Previous Owner | Larsen Christian Lyal | $127,687 |
Source: Public Records
Tax History Compared to Growth
Tax History
| Year | Tax Paid | Tax Assessment Tax Assessment Total Assessment is a certain percentage of the fair market value that is determined by local assessors to be the total taxable value of land and additions on the property. | Land | Improvement |
|---|---|---|---|---|
| 2025 | $1,960 | $205,700 | $98,092 | $107,608 |
| 2024 | $1,872 | $198,000 | $114,225 | $83,775 |
| 2023 | $1,862 | $347,000 | $135,139 | $211,861 |
| 2022 | $1,935 | $195,800 | $71,647 | $124,153 |
| 2021 | $1,696 | $256,000 | $101,021 | $154,979 |
| 2020 | $1,533 | $222,000 | $84,783 | $137,217 |
| 2019 | $1,544 | $219,000 | $80,325 | $138,675 |
| 2018 | $1,391 | $198,000 | $80,325 | $117,675 |
| 2016 | $1,136 | $83,435 | $25,804 | $57,631 |
| 2015 | $1,111 | $77,495 | $25,804 | $51,691 |
| 2014 | $1,127 | $80,340 | $25,804 | $54,536 |
| 2013 | -- | $73,788 | $18,612 | $55,176 |
Source: Public Records
Map
Nearby Homes
- 2248 N 500 W
- 2233 N 475 W
- 506 W 2200 N
- 2211 N 525 W
- 2600 N Hill Field Rd Unit 108
- 2600 N Hill Field Rd Unit 4
- 2875 N Hill Field Rd Unit 17
- 2875 N Hill Field Rd Unit 199
- 2875 N Hill Field Rd Unit 58
- 2875 N Hill Field Rd Unit 62
- 2875 N Hill Field Rd Unit 40
- 95 W 2400 N
- 61 Sunset Dr
- 2500 N Fort Ln Unit 238
- 2149 N 750 W
- 14 Lakeview Dr
- 141 Cushing Way
- 121 Barrington Way
- 202 Darlington Way
- 203 Darlington Way