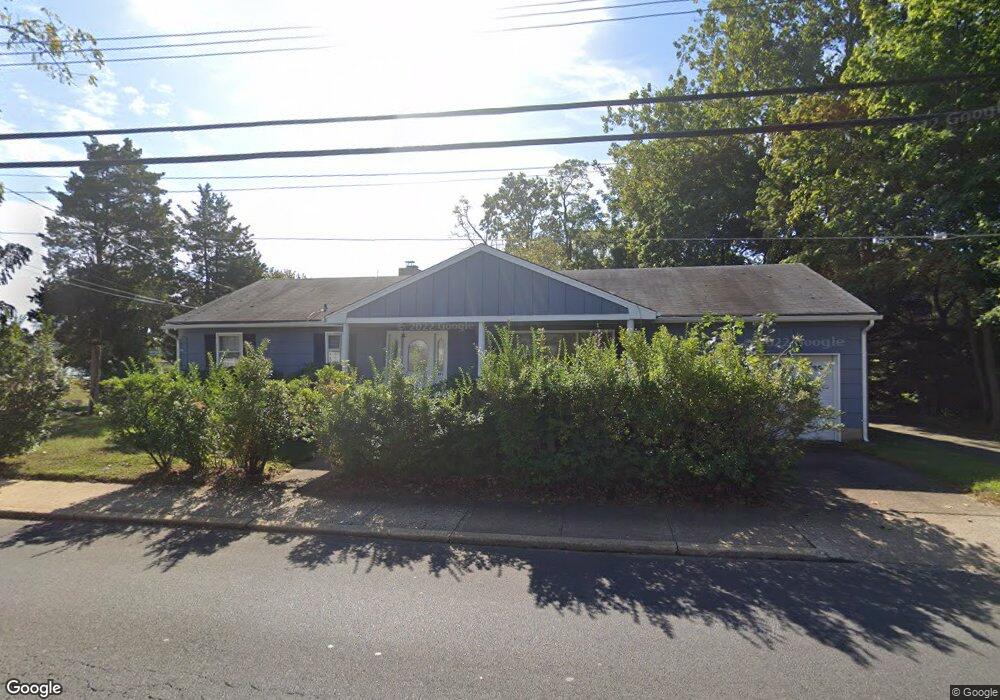
491 W Front St Red Bank, NJ 07701
New Monmouth NeighborhoodEstimated Value: $746,067 - $806,000
3
Beds
2
Baths
1,580
Sq Ft
$486/Sq Ft
Est. Value
About This Home
This home is located at 491 W Front St, Red Bank, NJ 07701 and is currently estimated at $767,356, approximately $485 per square foot. 491 W Front St is a home located in Monmouth County with nearby schools including River Plaza Elementary School, Thompson Middle School, and Middletown - South High School.
Ownership History
Date
Name
Owned For
Owner Type
Purchase Details
Closed on
Nov 9, 2023
Sold by
Defilippo Robert John
Bought by
County Of Monmouth
Current Estimated Value
Purchase Details
Closed on
Sep 11, 2015
Sold by
Defilippo Robert J
Bought by
Defilippo Robert J
Purchase Details
Closed on
Nov 13, 2007
Sold by
Defilippo Anne
Bought by
Defilippo Anne and Defilippo Robert John
Create a Home Valuation Report for This Property
The Home Valuation Report is an in-depth analysis detailing your home's value as well as a comparison with similar homes in the area
Home Values in the Area
Average Home Value in this Area
Purchase History
| Date | Buyer | Sale Price | Title Company |
|---|---|---|---|
| County Of Monmouth | $390,000 | None Listed On Document | |
| County Of Monmouth | $390,000 | None Listed On Document | |
| County Of Monmouth | -- | None Listed On Document | |
| County Of Monmouth | -- | None Listed On Document | |
| Defilippo Robert J | -- | Attorney | |
| Defilippo Anne | -- | None Available |
Source: Public Records
Tax History Compared to Growth
Tax History
| Year | Tax Paid | Tax Assessment Tax Assessment Total Assessment is a certain percentage of the fair market value that is determined by local assessors to be the total taxable value of land and additions on the property. | Land | Improvement |
|---|---|---|---|---|
| 2025 | $8,595 | $591,800 | $431,600 | $160,200 |
| 2024 | $7,811 | $522,500 | $365,300 | $157,200 |
| 2023 | $7,811 | $449,400 | $334,500 | $114,900 |
| 2022 | $7,592 | $397,600 | $288,200 | $109,400 |
| 2021 | $7,592 | $365,000 | $267,700 | $97,300 |
| 2020 | $7,485 | $350,100 | $255,000 | $95,100 |
| 2019 | $7,381 | $349,500 | $255,000 | $94,500 |
| 2018 | $7,478 | $345,100 | $255,000 | $90,100 |
| 2017 | $7,273 | $342,400 | $255,000 | $87,400 |
| 2016 | $6,962 | $326,700 | $241,500 | $85,200 |
| 2015 | $6,989 | $327,200 | $241,500 | $85,700 |
| 2014 | $6,714 | $306,700 | $219,000 | $87,700 |
Source: Public Records
Map
Nearby Homes
- 13 Applegate St
- 15 Hillside St
- 928 Park Place
- 11 Buchhop Ln Unit 5
- 11 Buchhop Ln
- 7 Buchhop Ln
- 6 Buchhop Ln
- 74 Leighton Ave
- 121 Catherine St
- 167 River St
- 33 Auburn Ct Unit G
- 3 Auburn Ct
- 8 Cherry St
- 159 Bridge Ave
- 171-173 Bridge Ave
- 16 Concord Ct Unit 15D
- 22 Claremont Ct Unit 33E
- 79 Lake Shore Dr
- 7 Lexington Ct
- 130 Bodman Place Unit 15