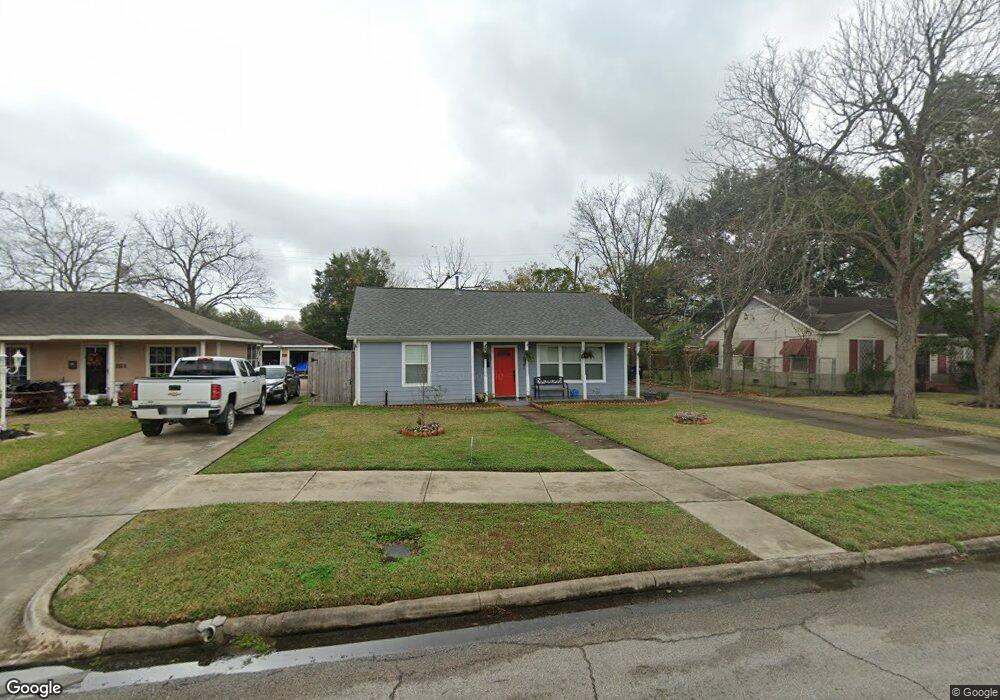
4910 Arvilla Ln Houston, TX 77021
OST-South Union NeighborhoodEstimated Value: $245,000 - $353,000
3
Beds
2
Baths
1,546
Sq Ft
$184/Sq Ft
Est. Value
About This Home
This home is located at 4910 Arvilla Ln, Houston, TX 77021 and is currently estimated at $285,155, approximately $184 per square foot. 4910 Arvilla Ln is a home located in Harris County with nearby schools including Peck Elementary School, Cullen Middle School, and Yates High School.
Ownership History
Date
Name
Owned For
Owner Type
Purchase Details
Closed on
Aug 29, 2016
Sold by
Palanca Opportunity Housing Llc
Bought by
Murphy Christopher J and Cherry Katelin
Current Estimated Value
Home Financials for this Owner
Home Financials are based on the most recent Mortgage that was taken out on this home.
Original Mortgage
$210,000
Outstanding Balance
$168,009
Interest Rate
3.48%
Mortgage Type
New Conventional
Estimated Equity
$117,146
Purchase Details
Closed on
Oct 27, 2015
Sold by
Harkor Homes Llc
Bought by
Palanca Opportunity Housing Llc
Home Financials for this Owner
Home Financials are based on the most recent Mortgage that was taken out on this home.
Original Mortgage
$578,400
Interest Rate
3.94%
Mortgage Type
Commercial
Purchase Details
Closed on
Oct 23, 2015
Sold by
Katy Home Llc
Bought by
Harkor Homes Llc
Home Financials for this Owner
Home Financials are based on the most recent Mortgage that was taken out on this home.
Original Mortgage
$578,400
Interest Rate
3.94%
Mortgage Type
Commercial
Purchase Details
Closed on
Sep 1, 2015
Sold by
Lyons Edward C
Bought by
Katy Home Llc
Home Financials for this Owner
Home Financials are based on the most recent Mortgage that was taken out on this home.
Original Mortgage
$578,400
Interest Rate
3.94%
Mortgage Type
Commercial
Create a Home Valuation Report for This Property
The Home Valuation Report is an in-depth analysis detailing your home's value as well as a comparison with similar homes in the area
Home Values in the Area
Average Home Value in this Area
Purchase History
| Date | Buyer | Sale Price | Title Company |
|---|---|---|---|
| Murphy Christopher J | -- | None Available | |
| Palanca Opportunity Housing Llc | -- | Alamo Title Co | |
| Harkor Homes Llc | -- | None Available | |
| Katy Home Llc | -- | None Available |
Source: Public Records
Mortgage History
| Date | Status | Borrower | Loan Amount |
|---|---|---|---|
| Open | Murphy Christopher J | $210,000 | |
| Previous Owner | Palanca Opportunity Housing Llc | $578,400 |
Source: Public Records
Tax History Compared to Growth
Tax History
| Year | Tax Paid | Tax Assessment Tax Assessment Total Assessment is a certain percentage of the fair market value that is determined by local assessors to be the total taxable value of land and additions on the property. | Land | Improvement |
|---|---|---|---|---|
| 2025 | $3,796 | $278,171 | $136,125 | $142,046 |
| 2024 | $3,796 | $278,171 | $136,125 | $142,046 |
| 2023 | $3,796 | $295,280 | $136,125 | $159,155 |
| 2022 | $5,411 | $282,995 | $121,000 | $161,995 |
| 2021 | $4,948 | $255,578 | $105,875 | $149,703 |
| 2020 | $4,896 | $216,363 | $75,625 | $140,738 |
| 2019 | $4,642 | $192,561 | $68,063 | $124,498 |
| 2018 | $2,745 | $164,284 | $59,094 | $105,190 |
| 2017 | $3,599 | $136,133 | $45,750 | $90,383 |
| 2016 | $2,434 | $92,089 | $36,219 | $55,870 |
| 2015 | $2,003 | $92,889 | $36,219 | $56,670 |
| 2014 | $2,003 | $77,929 | $36,219 | $41,710 |
Source: Public Records
Map
Nearby Homes
- 4902 Marietta Ln
- 4850 Marietta Ln
- 4838 Marietta Ln
- 4826 Ventura Ln
- 5026 Marietta Ln
- 4930 Culmore Dr
- 4923 Winnetka St
- 4918 Culmore Dr
- 5003 Yesenia Palm St
- 5314 Dezirae Ln
- 4928 Old Spanish Trail
- 5610 Milart St
- 5024 Winnetka St Unit B
- 5024 Winnetka St Unit C
- 5024 Winnetka St
- 5002 Elizabeth City St
- 4914 Gammage St
- 5004 Elizabeth City St
- 5009 Elizabeth City St
- 4735 Marietta Ln
- 4906 Arvilla Ln
- 4914 Arvilla Ln
- 4918 Arvilla Ln
- 4902 Arvilla Ln
- 4915 Marietta Ln
- 4907 Marietta Ln
- 4919 Marietta Ln
- 4903 Marietta Ln
- 4911 Arvilla Ln
- 4907 Arvilla Ln
- 4922 Arvilla Ln
- 4915 Arvilla Ln
- 4903 Arvilla Ln
- 4919 Arvilla Ln
- 4923 Marietta Ln
- 4926 Arvilla Ln
- 4850 Arvilla Ln
- 4923 Arvilla Ln
- 4927 Marietta Ln
- 4851 Marietta Ln