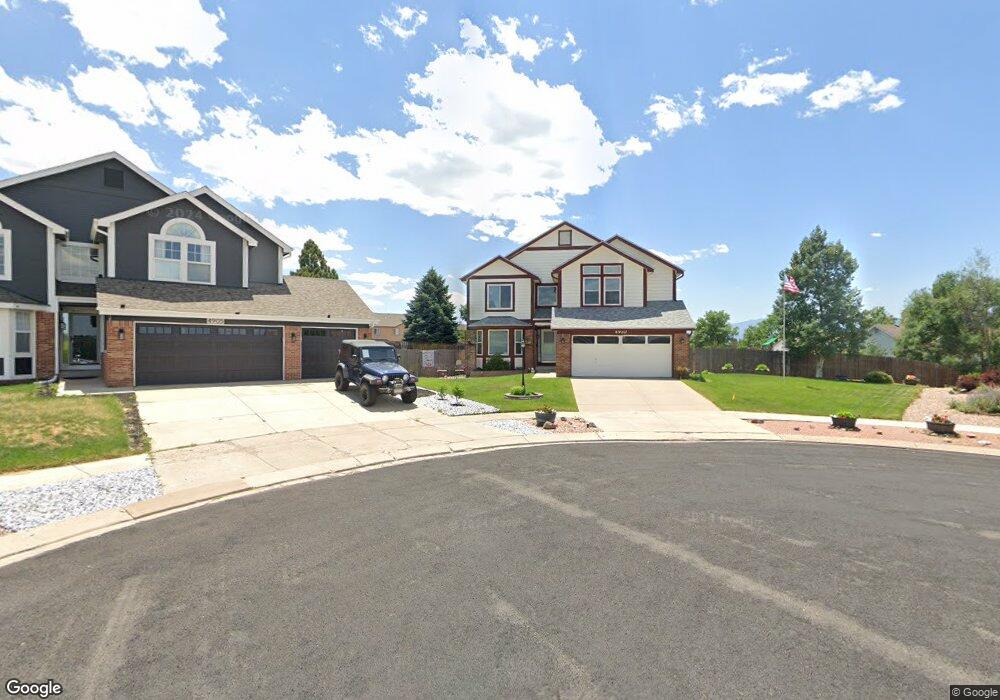
4910 Nugent Dr Colorado Springs, CO 80922
Stetson Hills NeighborhoodEstimated Value: $526,626 - $560,000
4
Beds
3
Baths
2,262
Sq Ft
$243/Sq Ft
Est. Value
About This Home
This home is located at 4910 Nugent Dr, Colorado Springs, CO 80922 and is currently estimated at $549,157, approximately $242 per square foot. 4910 Nugent Dr is a home located in El Paso County with nearby schools including Stetson Elementary School, Skyview Middle School, and Sand Creek High School.
Ownership History
Date
Name
Owned For
Owner Type
Purchase Details
Closed on
Mar 27, 2009
Sold by
Rogers Darsie D and Rogers Kimberly M
Bought by
Ingles Mark S
Current Estimated Value
Home Financials for this Owner
Home Financials are based on the most recent Mortgage that was taken out on this home.
Original Mortgage
$235,277
Outstanding Balance
$150,876
Interest Rate
5.21%
Mortgage Type
VA
Estimated Equity
$398,281
Purchase Details
Closed on
May 9, 2002
Sold by
Wolf Jason D and Wolf Kari Lyn
Bought by
Rogers Darsie D and Rogers Kimberly M
Home Financials for this Owner
Home Financials are based on the most recent Mortgage that was taken out on this home.
Original Mortgage
$225,550
Interest Rate
6.92%
Mortgage Type
VA
Purchase Details
Closed on
Nov 30, 1998
Sold by
U S Home Corp
Bought by
Wolf Jason D and Wolf Kari Lyn
Home Financials for this Owner
Home Financials are based on the most recent Mortgage that was taken out on this home.
Original Mortgage
$139,800
Interest Rate
6.69%
Create a Home Valuation Report for This Property
The Home Valuation Report is an in-depth analysis detailing your home's value as well as a comparison with similar homes in the area
Home Values in the Area
Average Home Value in this Area
Purchase History
| Date | Buyer | Sale Price | Title Company |
|---|---|---|---|
| Ingles Mark S | $244,000 | Land Title Guarantee Company | |
| Rogers Darsie D | $219,000 | Security Title | |
| Wolf Jason D | $147,200 | Stewart Title |
Source: Public Records
Mortgage History
| Date | Status | Borrower | Loan Amount |
|---|---|---|---|
| Open | Ingles Mark S | $235,277 | |
| Previous Owner | Rogers Darsie D | $225,550 | |
| Previous Owner | Wolf Jason D | $139,800 |
Source: Public Records
Tax History Compared to Growth
Tax History
| Year | Tax Paid | Tax Assessment Tax Assessment Total Assessment is a certain percentage of the fair market value that is determined by local assessors to be the total taxable value of land and additions on the property. | Land | Improvement |
|---|---|---|---|---|
| 2025 | $2,058 | $36,330 | -- | -- |
| 2024 | $1,959 | $36,300 | $6,470 | $29,830 |
| 2023 | $1,959 | $36,300 | $6,470 | $29,830 |
| 2022 | $1,614 | $25,960 | $5,840 | $20,120 |
| 2021 | $1,681 | $26,710 | $6,010 | $20,700 |
| 2020 | $1,528 | $24,000 | $5,010 | $18,990 |
| 2019 | $1,512 | $24,000 | $5,010 | $18,990 |
| 2018 | $1,308 | $20,370 | $4,380 | $15,990 |
| 2017 | $1,314 | $20,370 | $4,380 | $15,990 |
| 2016 | $1,332 | $20,370 | $4,120 | $16,250 |
| 2015 | $1,333 | $20,370 | $4,120 | $16,250 |
| 2014 | $1,204 | $18,060 | $3,900 | $14,160 |
Source: Public Records
Map
Nearby Homes
- 7010 Highcroft Dr
- 7020 Hillbeck Dr
- 7120 Highcroft Dr
- 4034 Ryedale Way
- 4604 Desert Varnish Dr
- 5041 Weaver Dr
- 6330 Emma Ln
- 4632 Hidden River Dr
- 4457 Centerville Dr
- 6980 Ashley Dr
- 5275 Belle Star Dr
- 4669 Desert Varnish Dr
- 5307 Belle Star Dr
- 4489 Crow Creek Dr
- 4831 Desert Varnish Dr
- 6170 Katy Ct
- 6180 Kettle Ct
- 5315 War Paint Place
- 6185 Hearth Ct
- 7084 Ash Creek Heights Unit 201
- 4920 Nugent Dr
- 4905 Nugent Dr
- 4915 Leighton Dr
- 4925 Leighton Dr
- 4930 Nugent Dr
- 4915 Nugent Dr
- 4549 Leighton Dr
- 4935 Leighton Dr
- 4925 Nugent Dr
- 4940 Nugent Dr
- 4905 Leighton Dr
- 4795 Kerry Lynn View
- 4797 Kerry Lynn View
- 4791 Kerry Lynn View
- 4793 Kerry Lynn View
- 4799 Kerry Lynn View Unit 101
- 4799 Kerry Lynn View Unit 201
- 4789 Kerry Lynn View
- 4945 Leighton Dr
- 4945 Nugent Dr