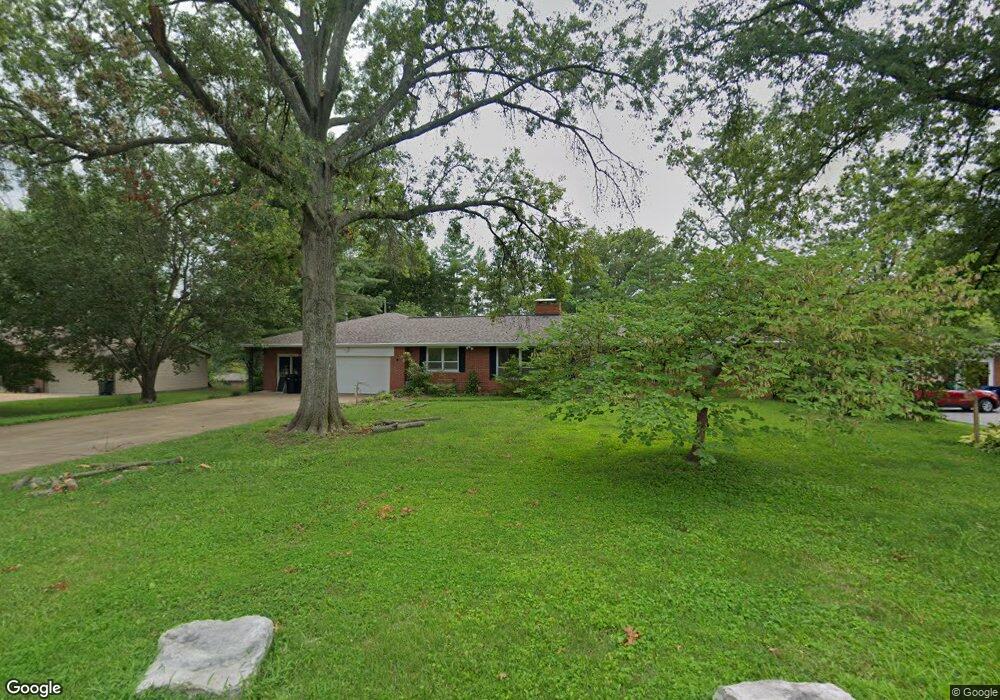
4910 Valley Crest Dr Saint Louis, MO 63128
Estimated Value: $498,958 - $605,000
4
Beds
3
Baths
2,456
Sq Ft
$217/Sq Ft
Est. Value
About This Home
This home is located at 4910 Valley Crest Dr, Saint Louis, MO 63128 and is currently estimated at $533,740, approximately $217 per square foot. 4910 Valley Crest Dr is a home located in St. Louis County with nearby schools including Sappington Elementary School, Sperreng Middle School, and Lindbergh High School.
Ownership History
Date
Name
Owned For
Owner Type
Purchase Details
Closed on
Jan 23, 2023
Sold by
Unger Joseph F and Unger Cynthia L
Bought by
Unger Revocable Trust
Current Estimated Value
Purchase Details
Closed on
Jun 5, 2009
Sold by
Koch Greg J and Koch Katie
Bought by
Unger Joseph F and Unger Cynthia Campbell
Home Financials for this Owner
Home Financials are based on the most recent Mortgage that was taken out on this home.
Original Mortgage
$250,000
Interest Rate
4.97%
Mortgage Type
Purchase Money Mortgage
Purchase Details
Closed on
Sep 21, 2007
Sold by
Weber Gloria Richie
Bought by
Koch Greg J and Koch Katie
Home Financials for this Owner
Home Financials are based on the most recent Mortgage that was taken out on this home.
Original Mortgage
$287,000
Interest Rate
6.55%
Mortgage Type
Purchase Money Mortgage
Purchase Details
Closed on
Oct 27, 2005
Sold by
Weber John R and Weber Gloria R
Bought by
Weber Gloria Richie and Gloria Richie Weber Revocable Living Tr
Create a Home Valuation Report for This Property
The Home Valuation Report is an in-depth analysis detailing your home's value as well as a comparison with similar homes in the area
Home Values in the Area
Average Home Value in this Area
Purchase History
| Date | Buyer | Sale Price | Title Company |
|---|---|---|---|
| Unger Revocable Trust | -- | -- | |
| Unger Joseph F | $325,000 | None Available | |
| Koch Greg J | $287,000 | Clt | |
| Weber Gloria Richie | -- | -- |
Source: Public Records
Mortgage History
| Date | Status | Borrower | Loan Amount |
|---|---|---|---|
| Previous Owner | Unger Joseph F | $250,000 | |
| Previous Owner | Koch Greg J | $287,000 |
Source: Public Records
Tax History Compared to Growth
Tax History
| Year | Tax Paid | Tax Assessment Tax Assessment Total Assessment is a certain percentage of the fair market value that is determined by local assessors to be the total taxable value of land and additions on the property. | Land | Improvement |
|---|---|---|---|---|
| 2025 | $4,769 | $75,870 | $25,650 | $50,220 |
| 2024 | $4,769 | $73,400 | $23,520 | $49,880 |
| 2023 | $4,757 | $73,400 | $23,520 | $49,880 |
| 2022 | $4,548 | $67,330 | $23,520 | $43,810 |
| 2021 | $4,386 | $67,330 | $23,520 | $43,810 |
| 2020 | $4,403 | $65,210 | $17,860 | $47,350 |
| 2019 | $4,392 | $65,210 | $17,860 | $47,350 |
| 2018 | $4,101 | $55,370 | $11,060 | $44,310 |
| 2017 | $4,056 | $55,370 | $11,060 | $44,310 |
| 2016 | $3,724 | $48,240 | $11,060 | $37,180 |
| 2015 | $3,667 | $48,240 | $11,060 | $37,180 |
| 2014 | $3,457 | $45,010 | $7,730 | $37,280 |
Source: Public Records
Map
Nearby Homes
- 4838 Dorsie Dr
- 4931 Theiss Rd
- 11862 E Concord Rd
- 4849 Gatesbury Dr
- 25 Fawnwood Dr
- 12015 Charwick Dr
- 4449 Pinyon Jay Ct
- 12055 Charwick Dr
- 4740 Hedgemont Dr
- 11673 Rossmoor Ln
- 4829 Vermilion Dr
- 5837 Oak Forest Ln
- 11345 Revere Ln
- 4700 Theiss Rd
- 4642 Theiss Rd
- 4818 Chapel Hill Dr
- 11542 Concord Village Ave
- 10070 Sakura Dr Unit 100070
- 10080 Sakura Dr Unit 1
- 10080 Sakura Dr Unit 8
- 4916 Valley Crest Dr
- 4904 Valley Crest Dr
- 4864 Vicie Ct
- 4867 Vicie Ct
- 4917 Valley Crest Dr
- 4911 Valley Crest Dr
- 4878 Valley Crest Dr
- 4918 Valley Crest Dr
- 4901 Valley Crest Dr
- 4923 Valley Crest Dr
- 4856 Vicie Ct
- 4871 Vicie Ct
- 4924 Ardeth Ct
- 4870 Valley Crest Dr
- 4922 Valley Crest Dr
- 4920 Ardeth Ct
- 4929 Valley Crest Dr
- 4207 Valley Crest Hills Dr
- 4215 Valley Crest Hills Dr
- 4871 Valley Crest Dr