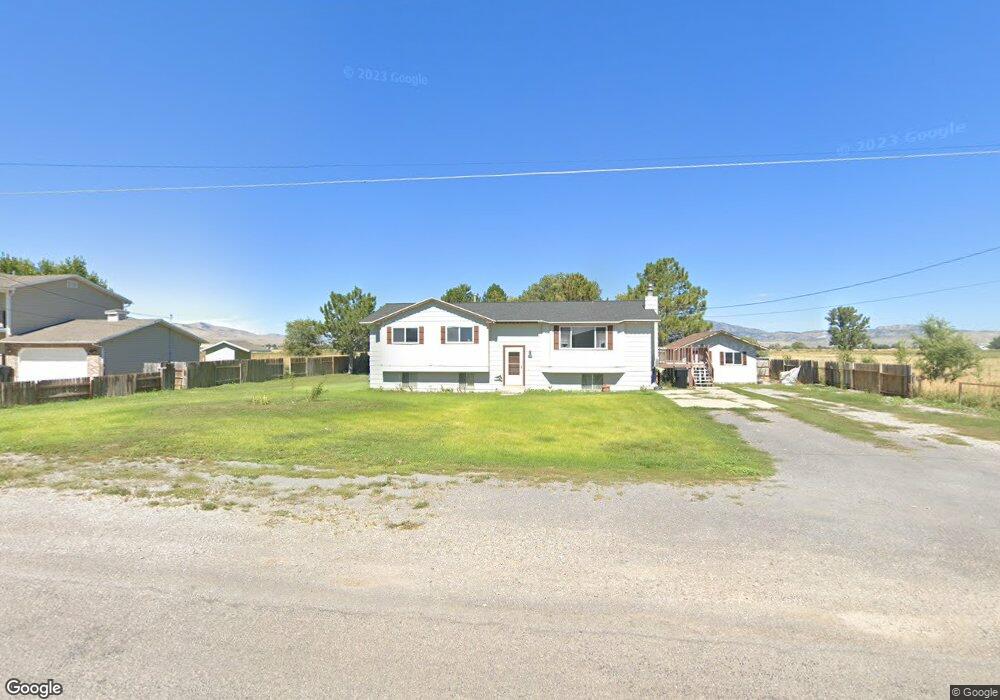
4910 W 14400 N Garland, UT 84312
Estimated Value: $378,000 - $438,000
4
Beds
2
Baths
2,471
Sq Ft
$168/Sq Ft
Est. Value
About This Home
This home is located at 4910 W 14400 N, Garland, UT 84312 and is currently estimated at $415,950, approximately $168 per square foot. 4910 W 14400 N is a home located in Box Elder County with nearby schools including Fielding School, Bear River Middle School, and Alice C. Harris Intermediate School.
Ownership History
Date
Name
Owned For
Owner Type
Purchase Details
Closed on
Sep 5, 2024
Sold by
Banuelos Marianito and Banuelos Alondra
Bought by
Rasmussen Mark and Rasmussen Sarah
Current Estimated Value
Home Financials for this Owner
Home Financials are based on the most recent Mortgage that was taken out on this home.
Original Mortgage
$21,301
Outstanding Balance
$21,075
Interest Rate
6.78%
Estimated Equity
$394,875
Purchase Details
Closed on
Aug 1, 2018
Sold by
Fronk Colton J and Fronk Randi
Bought by
Banuelos Marilanito and Banuelos Alondra
Home Financials for this Owner
Home Financials are based on the most recent Mortgage that was taken out on this home.
Original Mortgage
$222,888
Interest Rate
4.83%
Mortgage Type
FHA
Purchase Details
Closed on
Feb 26, 2015
Sold by
Elder Box
Bought by
Fronk Colton J and Fronk Brandi
Home Financials for this Owner
Home Financials are based on the most recent Mortgage that was taken out on this home.
Original Mortgage
$158,163
Interest Rate
3.6%
Mortgage Type
New Conventional
Create a Home Valuation Report for This Property
The Home Valuation Report is an in-depth analysis detailing your home's value as well as a comparison with similar homes in the area
Home Values in the Area
Average Home Value in this Area
Purchase History
| Date | Buyer | Sale Price | Title Company |
|---|---|---|---|
| Rasmussen Mark | -- | First American Title | |
| Banuelos Marilanito | -- | Amerian Secure Title Tremont | |
| Fronk Colton J | -- | American Secure Title Tremon |
Source: Public Records
Mortgage History
| Date | Status | Borrower | Loan Amount |
|---|---|---|---|
| Open | Rasmussen Mark | $21,301 | |
| Open | Rasmussen Mark | $355,020 | |
| Previous Owner | Banuelos Marilanito | $222,888 | |
| Previous Owner | Fronk Colton J | $158,163 |
Source: Public Records
Tax History Compared to Growth
Tax History
| Year | Tax Paid | Tax Assessment Tax Assessment Total Assessment is a certain percentage of the fair market value that is determined by local assessors to be the total taxable value of land and additions on the property. | Land | Improvement |
|---|---|---|---|---|
| 2025 | $1,953 | $379,583 | $130,000 | $249,583 |
| 2024 | $1,696 | $373,983 | $130,000 | $243,983 |
| 2023 | $1,740 | $388,147 | $130,000 | $258,147 |
| 2022 | $1,681 | $194,334 | $35,750 | $158,584 |
| 2021 | $1,493 | $251,547 | $30,000 | $221,547 |
| 2020 | $1,387 | $251,547 | $30,000 | $221,547 |
| 2019 | $1,234 | $118,042 | $16,500 | $101,542 |
| 2018 | $774 | $69,119 | $16,500 | $52,619 |
| 2017 | $801 | $125,671 | $16,500 | $95,671 |
| 2016 | $767 | $66,613 | $16,500 | $50,113 |
| 2015 | $697 | $62,058 | $16,500 | $45,558 |
| 2014 | $697 | $59,888 | $16,500 | $43,388 |
| 2013 | -- | $55,944 | $16,500 | $39,444 |
Source: Public Records
Map
Nearby Homes
- 14296 N 5350 W
- 4770 W 13600 N
- 15125 N 4400 W
- 15270 N 5475 W
- 14360 N 6000 W
- 14376 N 6000 W
- 14345 N 6000 W
- 3536 W 14100 N
- 13200 N 6000 W
- 15920 N 4000 W Unit 14
- 16449 N 6000 W
- 627 N Main St
- 169 N 400 E
- 13700 N 3100 W
- 112 S Main St
- 16115 N 6000 W
- Berrington Plan at Lookout Mountain
- Stanton Plan at Lookout Mountain
- Cambria Plan at Lookout Mountain
- Brantwood Plan at Lookout Mountain