Estimated Value: $452,000 - $488,000
5
Beds
3
Baths
2,150
Sq Ft
$220/Sq Ft
Est. Value
About This Home
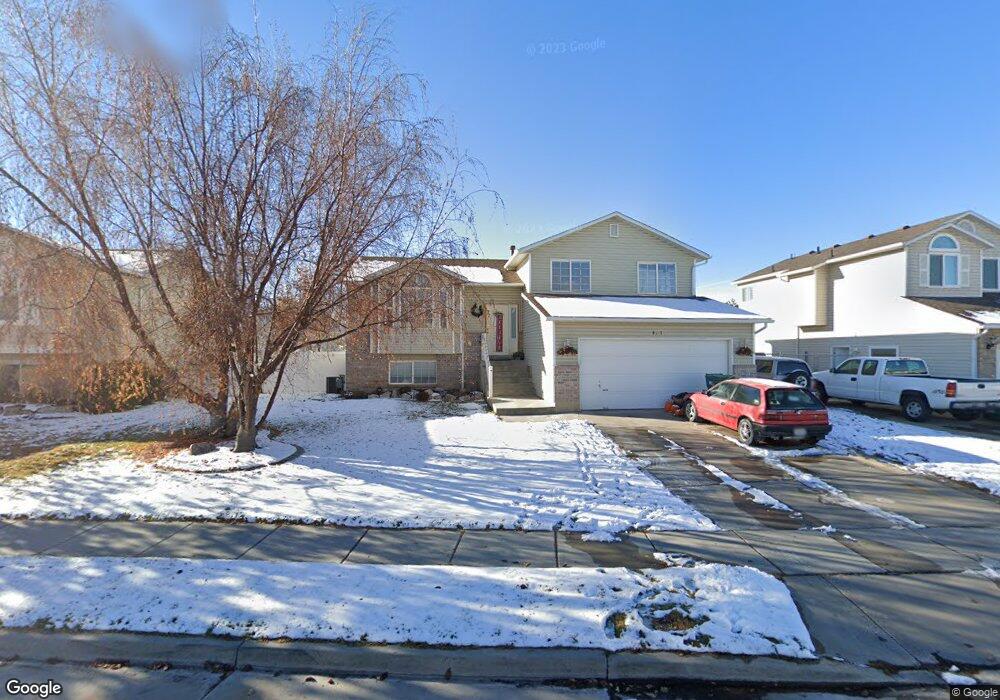
This home is located at 4911 S 3975 W, Roy, UT 84067 and is currently estimated at $473,421, approximately $220 per square foot. 4911 S 3975 W is a home located in Weber County with nearby schools including Country View School, Rocky Mountain Junior High School, and Bridge Elementary School.
Ownership History
Date
Name
Owned For
Owner Type
Purchase Details
Closed on
Aug 6, 2012
Sold by
Sanders Sterling
Bought by
Sanders Andrea
Current Estimated Value
Home Financials for this Owner
Home Financials are based on the most recent Mortgage that was taken out on this home.
Original Mortgage
$136,470
Outstanding Balance
$94,317
Interest Rate
3.62%
Mortgage Type
New Conventional
Estimated Equity
$379,104
Purchase Details
Closed on
Jun 24, 2005
Sold by
Wright Travis J and Wright Kathy D
Bought by
Sanders Sterling and Sanders Andrea
Home Financials for this Owner
Home Financials are based on the most recent Mortgage that was taken out on this home.
Original Mortgage
$153,797
Interest Rate
5.65%
Mortgage Type
FHA
Purchase Details
Closed on
Aug 19, 1999
Sold by
Country West Const & Real Estate Inc
Bought by
Wright Travis J and Wright Kathy D
Home Financials for this Owner
Home Financials are based on the most recent Mortgage that was taken out on this home.
Original Mortgage
$130,356
Interest Rate
7.63%
Mortgage Type
VA
Create a Home Valuation Report for This Property
The Home Valuation Report is an in-depth analysis detailing your home's value as well as a comparison with similar homes in the area
Home Values in the Area
Average Home Value in this Area
Purchase History
| Date | Buyer | Sale Price | Title Company |
|---|---|---|---|
| Sanders Andrea | -- | Inwest Title | |
| Sanders Sterling | -- | Equity Title South Ogden | |
| Wright Travis J | -- | Bonneville Title |
Source: Public Records
Mortgage History
| Date | Status | Borrower | Loan Amount |
|---|---|---|---|
| Open | Sanders Andrea | $136,470 | |
| Closed | Sanders Sterling | $153,797 | |
| Previous Owner | Wright Travis J | $130,356 |
Source: Public Records
Tax History
| Year | Tax Paid | Tax Assessment Tax Assessment Total Assessment is a certain percentage of the fair market value that is determined by local assessors to be the total taxable value of land and additions on the property. | Land | Improvement |
|---|---|---|---|---|
| 2025 | $2,856 | $457,100 | $125,007 | $332,093 |
| 2024 | $2,786 | $449,000 | $125,007 | $323,993 |
| 2023 | $2,756 | $446,000 | $119,753 | $326,247 |
| 2022 | $2,837 | $473,000 | $105,014 | $367,986 |
| 2021 | $2,246 | $337,000 | $79,963 | $257,037 |
| 2020 | $2,271 | $315,000 | $79,963 | $235,037 |
| 2019 | $2,121 | $276,000 | $44,976 | $231,024 |
| 2018 | $2,032 | $249,000 | $41,029 | $207,971 |
| 2017 | $1,816 | $207,000 | $41,029 | $165,971 |
| 2016 | $1,740 | $106,567 | $21,944 | $84,623 |
| 2015 | $1,557 | $97,063 | $21,944 | $75,119 |
| 2014 | $1,571 | $97,064 | $19,237 | $77,827 |
Source: Public Records
Map
Nearby Homes
- 4950 3900 West St
- 4088 W 5050 S
- 4813 S 3850 W
- 4096 W 5075 S
- 4218 W 5050 S
- 4024 W 4650 S
- 4602 S 4000 W
- 4853 S 4275 W Unit 27
- 4101 W 4600 S
- 4216 W 5250 S
- 5035 S 4275 W
- 4277 W 5250 S
- 4239 W 5325 S
- 3517 W 4835 S Unit 27
- 3509 W 4835 S Unit 26
- 5444 S 4050 W
- 4486 S 4300 W
- 3443 W 5200 S Unit 2&3
- 3610 W 4475 S
- 3808 W 4300 S
Your Personal Tour Guide
Ask me questions while you tour the home.