Estimated Value: $201,000 - $230,000
2
Beds
1
Bath
1,133
Sq Ft
$193/Sq Ft
Est. Value
About This Home
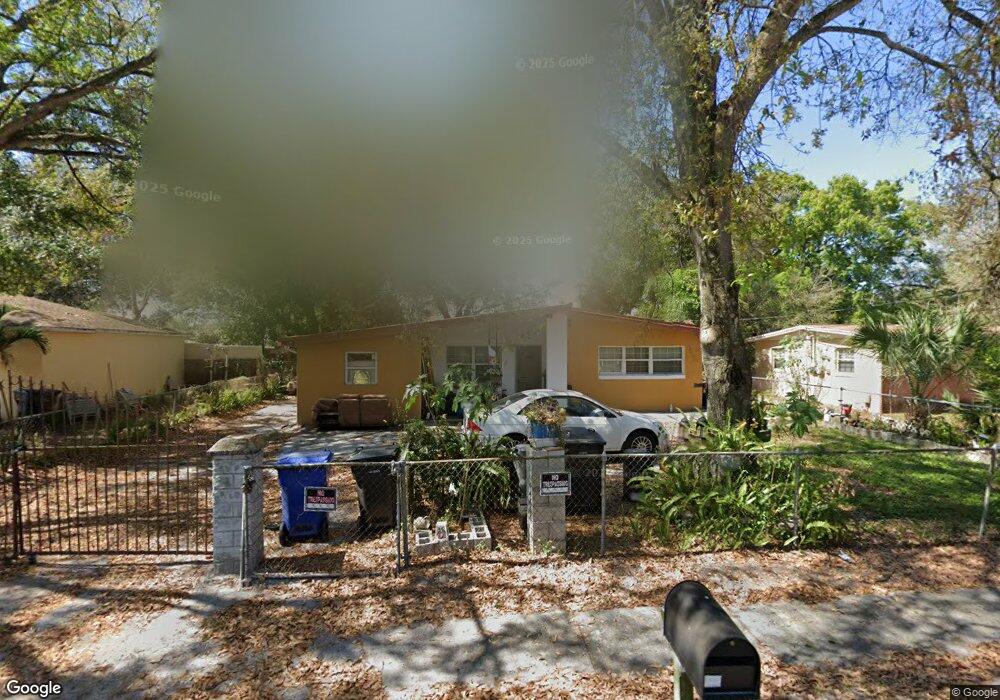
This home is located at 4911 S 81st St, Tampa, FL 33619 and is currently estimated at $218,476, approximately $192 per square foot. 4911 S 81st St is a home located in Hillsborough County with nearby schools including Lamb Elementary, Giunta Middle School, and Spoto High School.
Ownership History
Date
Name
Owned For
Owner Type
Purchase Details
Closed on
Aug 2, 2018
Sold by
Chaca Luisa
Bought by
Bravo Francisco and Bravo Luisa
Current Estimated Value
Purchase Details
Closed on
Dec 29, 2009
Sold by
Bay Area Trust Llc
Bought by
Chaca Luisa
Purchase Details
Closed on
Dec 15, 2009
Sold by
Mcclendon L J and Mcclendon Ellease
Bought by
Bay Area Trust Llc
Purchase Details
Closed on
Aug 19, 2005
Sold by
Mcclendon Ellease
Bought by
Mcclendon I J and Mcclendon Ellease
Home Financials for this Owner
Home Financials are based on the most recent Mortgage that was taken out on this home.
Original Mortgage
$86,000
Interest Rate
7.25%
Mortgage Type
Fannie Mae Freddie Mac
Purchase Details
Closed on
Apr 5, 1995
Sold by
Mcpherson Silvan and Mcpherson Grethel
Bought by
Mcclendon Ellease
Home Financials for this Owner
Home Financials are based on the most recent Mortgage that was taken out on this home.
Original Mortgage
$29,100
Interest Rate
8.7%
Create a Home Valuation Report for This Property
The Home Valuation Report is an in-depth analysis detailing your home's value as well as a comparison with similar homes in the area
Home Values in the Area
Average Home Value in this Area
Purchase History
| Date | Buyer | Sale Price | Title Company |
|---|---|---|---|
| Bravo Francisco | -- | None Available | |
| Chaca Luisa | $22,500 | Peer Title Inc | |
| Bay Area Trust Llc | $18,000 | Alday Donalson Title Agencie | |
| Mcclendon I J | $30,500 | Archer Land Title Inc | |
| Mcclendon Ellease | $30,000 | -- |
Source: Public Records
Mortgage History
| Date | Status | Borrower | Loan Amount |
|---|---|---|---|
| Previous Owner | Mcclendon I J | $86,000 | |
| Previous Owner | Mcclendon Ellease | $29,100 |
Source: Public Records
Tax History Compared to Growth
Tax History
| Year | Tax Paid | Tax Assessment Tax Assessment Total Assessment is a certain percentage of the fair market value that is determined by local assessors to be the total taxable value of land and additions on the property. | Land | Improvement |
|---|---|---|---|---|
| 2024 | $1,434 | $91,798 | -- | -- |
| 2023 | $1,350 | $89,124 | $0 | $0 |
| 2022 | $1,214 | $86,528 | $0 | $0 |
| 2021 | $1,183 | $84,008 | $0 | $0 |
| 2020 | $1,106 | $82,848 | $24,798 | $58,050 |
| 2019 | $1,286 | $74,472 | $21,255 | $53,217 |
| 2018 | $1,149 | $57,849 | $0 | $0 |
| 2017 | $1,012 | $42,752 | $0 | $0 |
| 2016 | $938 | $32,316 | $0 | $0 |
| 2015 | $886 | $29,378 | $0 | $0 |
| 2014 | $804 | $26,707 | $0 | $0 |
| 2013 | -- | $24,279 | $0 | $0 |
Source: Public Records
Map
Nearby Homes
- 5206 S 80th St
- 4920 S 82nd St
- 5210 S 80th St
- 4908 S 83rd St
- 4906 S 83rd St
- 5210 S 84th St
- 5003 S 86th St
- 5016 S 86th St
- 8310 Croton Ave
- 5707 S 79th St
- 4706 Woods Landing Ln
- 4708 Woods Landing Ln
- 7018 S 51st Ave
- 7013 S 51st Ave
- 7231 Spring Snowflake Ave
- 8827 Turnstone Haven Place
- 7023 S 51st Ave
- 8931 Turnstone Haven Place
- 4957 Wild Senna Blvd
- 8723 Turnstone Haven Place