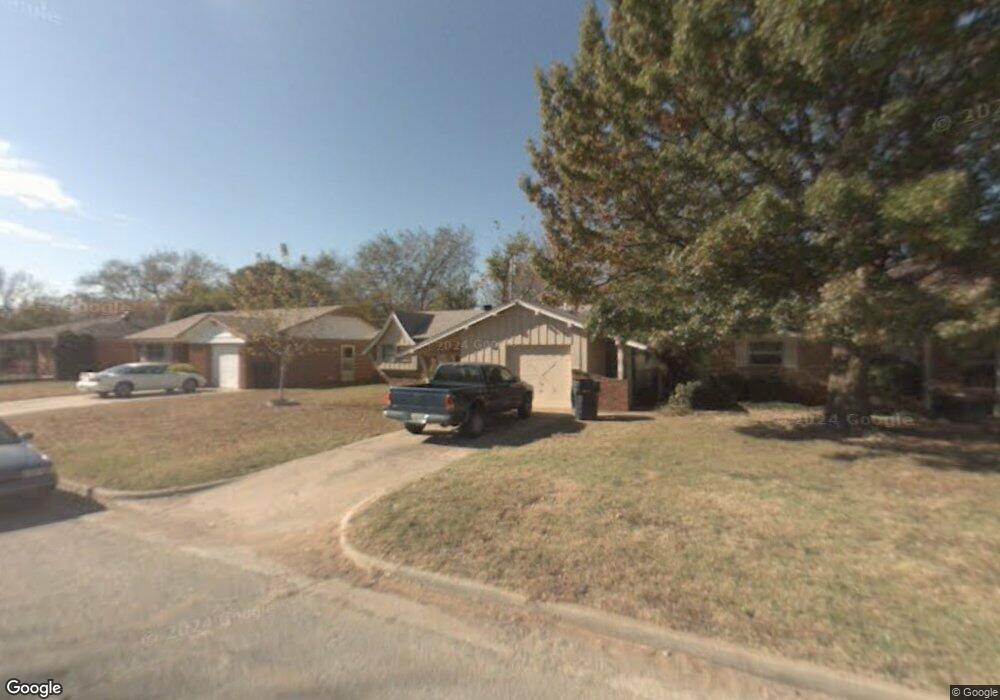
4911 S Broadway Place Oklahoma City, OK 73109
South Walker NeighborhoodEstimated Value: $101,000 - $136,000
3
Beds
2
Baths
994
Sq Ft
$121/Sq Ft
Est. Value
About This Home
This home is located at 4911 S Broadway Place, Oklahoma City, OK 73109 and is currently estimated at $120,667, approximately $121 per square foot. 4911 S Broadway Place is a home located in Oklahoma County with nearby schools including Fillmore Elementary School, Webster Middle School, and Capitol Hill High School.
Ownership History
Date
Name
Owned For
Owner Type
Purchase Details
Closed on
Mar 24, 2011
Sold by
Secretary Of Housing & Urban Development
Bought by
Kinney Enterprises Llc
Current Estimated Value
Home Financials for this Owner
Home Financials are based on the most recent Mortgage that was taken out on this home.
Original Mortgage
$500,000
Outstanding Balance
$347,568
Interest Rate
5.04%
Mortgage Type
Credit Line Revolving
Estimated Equity
-$226,901
Purchase Details
Closed on
Sep 3, 2010
Sold by
Bridges Andrea
Bought by
Secretary Of Housing & Urban Development
Purchase Details
Closed on
Nov 19, 1999
Sold by
Barber Alan J and Barner Michelle A
Bought by
Bridges Andrea E
Home Financials for this Owner
Home Financials are based on the most recent Mortgage that was taken out on this home.
Original Mortgage
$52,607
Interest Rate
7.93%
Mortgage Type
FHA
Create a Home Valuation Report for This Property
The Home Valuation Report is an in-depth analysis detailing your home's value as well as a comparison with similar homes in the area
Home Values in the Area
Average Home Value in this Area
Purchase History
| Date | Buyer | Sale Price | Title Company |
|---|---|---|---|
| Kinney Enterprises Llc | -- | Heartland Title & Closing Ll | |
| Secretary Of Housing & Urban Development | -- | None Available | |
| Bridges Andrea E | $50,000 | -- |
Source: Public Records
Mortgage History
| Date | Status | Borrower | Loan Amount |
|---|---|---|---|
| Open | Kinney Enterprises Llc | $500,000 | |
| Previous Owner | Bridges Andrea E | $52,607 |
Source: Public Records
Tax History Compared to Growth
Tax History
| Year | Tax Paid | Tax Assessment Tax Assessment Total Assessment is a certain percentage of the fair market value that is determined by local assessors to be the total taxable value of land and additions on the property. | Land | Improvement |
|---|---|---|---|---|
| 2024 | $1,096 | $9,728 | $1,198 | $8,530 |
| 2023 | $1,096 | $9,265 | $1,252 | $8,013 |
| 2022 | $994 | $8,824 | $1,174 | $7,650 |
| 2021 | $944 | $8,404 | $1,321 | $7,083 |
| 2020 | $907 | $8,004 | $1,466 | $6,538 |
| 2019 | $860 | $7,623 | $1,415 | $6,208 |
| 2018 | $822 | $7,260 | $0 | $0 |
| 2017 | $815 | $7,204 | $1,521 | $5,683 |
| 2016 | $784 | $6,929 | $1,521 | $5,408 |
| 2015 | $805 | $7,047 | $1,521 | $5,526 |
| 2014 | $804 | $7,078 | $1,416 | $5,662 |
Source: Public Records
Map
Nearby Homes
- 37 SW 50th St
- 227 SW 45th St
- 5309 S Santa fe Ave
- 48 SE 45th St
- 516 SW 46th St
- 0 SW 43rd St Unit Package of 36 units
- 400 SW 42nd St
- 620 SW 48th St
- 623 SW 48th St
- 230 SE 50th St
- 109 SE 42nd St
- 234 SE 51st St
- 4113 S Harvey Ave
- 629 SW 46th St
- 4312 S Lee Ave
- 624 SW 44th St
- 5502 S Shields Blvd
- 209 SW 40th St
- 321 SE 49th St
- 312 SE 45th St
- 107 SW 49th St
- 4909 S Broadway Place
- 4908 S Broadway Place
- 102 SW 49th St
- 111 SW 49th St
- 4905 S Broadway Place
- 106 SW 49th St
- 5005 S Broadway Place
- 4901 S Broadway Place
- 4900 S Broadway Place
- 5002 S Broadway Place
- 110 SW 49th St
- 121 SW 49th St
- 5004 S Broadway Place
- 5009 S Broadway Place
- 4821 S Broadway Place
- 114 SW 49th St
- 5006 S Broadway Place
- 125 SW 49th St
- 4830 S Broadway Place