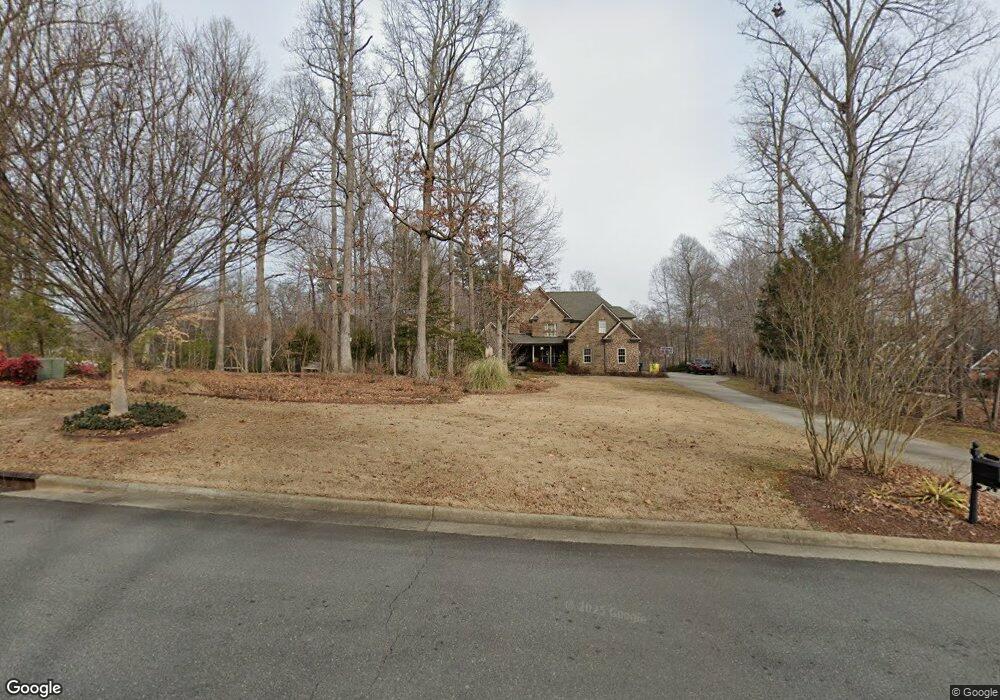
4911 Salem Glen Blvd Clemmons, NC 27012
Estimated Value: $628,978 - $860,000
4
Beds
3
Baths
3,483
Sq Ft
$207/Sq Ft
Est. Value
About This Home
This home is located at 4911 Salem Glen Blvd, Clemmons, NC 27012 and is currently estimated at $719,495, approximately $206 per square foot. 4911 Salem Glen Blvd is a home located in Forsyth County with nearby schools including Clemmons Elementary School, Clemmons Middle School, and West Forsyth High.
Ownership History
Date
Name
Owned For
Owner Type
Purchase Details
Closed on
Jun 23, 2010
Sold by
Bank Of North Carolina
Bought by
Wilson William G and Wilson Kathy R
Current Estimated Value
Home Financials for this Owner
Home Financials are based on the most recent Mortgage that was taken out on this home.
Original Mortgage
$320,000
Outstanding Balance
$212,986
Interest Rate
4.83%
Mortgage Type
Seller Take Back
Estimated Equity
$506,509
Purchase Details
Closed on
Mar 31, 2009
Sold by
Allen Wayne Builders Rhs Llc
Bought by
Bank Of North Carolina
Purchase Details
Closed on
Nov 29, 2007
Sold by
Drumheller John Franklin and Drumheller Lynn E Holder
Bought by
Allen Wayne Builders Rhs Llc
Home Financials for this Owner
Home Financials are based on the most recent Mortgage that was taken out on this home.
Original Mortgage
$447,200
Interest Rate
6.36%
Mortgage Type
Purchase Money Mortgage
Create a Home Valuation Report for This Property
The Home Valuation Report is an in-depth analysis detailing your home's value as well as a comparison with similar homes in the area
Home Values in the Area
Average Home Value in this Area
Purchase History
| Date | Buyer | Sale Price | Title Company |
|---|---|---|---|
| Wilson William G | $435,000 | None Available | |
| Bank Of North Carolina | $290,000 | None Available | |
| Allen Wayne Builders Rhs Llc | $120,000 | None Available |
Source: Public Records
Mortgage History
| Date | Status | Borrower | Loan Amount |
|---|---|---|---|
| Open | Wilson William G | $320,000 | |
| Previous Owner | Allen Wayne Builders Rhs Llc | $447,200 |
Source: Public Records
Tax History Compared to Growth
Tax History
| Year | Tax Paid | Tax Assessment Tax Assessment Total Assessment is a certain percentage of the fair market value that is determined by local assessors to be the total taxable value of land and additions on the property. | Land | Improvement |
|---|---|---|---|---|
| 2025 | $3,309 | $620,600 | $99,100 | $521,500 |
| 2024 | $3,222 | $434,400 | $74,400 | $360,000 |
| 2023 | $3,222 | $434,400 | $74,400 | $360,000 |
| 2022 | $3,222 | $434,400 | $74,400 | $360,000 |
| 2021 | $3,222 | $434,400 | $74,400 | $360,000 |
| 2020 | $3,868 | $477,000 | $135,100 | $341,900 |
| 2019 | $3,915 | $477,000 | $135,100 | $341,900 |
| 2018 | $3,696 | $469,600 | $135,100 | $334,500 |
| 2016 | $3,367 | $425,703 | $130,116 | $295,587 |
| 2015 | $3,367 | $425,703 | $130,116 | $295,587 |
| 2014 | $3,264 | $425,703 | $130,116 | $295,587 |
Source: Public Records
Map
Nearby Homes
- 925 Salem Glen Ct
- 113 Mcmichael Ct
- 5120 Dock Davis Rd
- 102 Salem Village Ct
- 6310 Hampton Knoll Rd
- 5269 Sunny Brook Ct
- 6482 Bluestone Park Dr
- 6067 Frye Bridge Rd
- Torino Plan at Salem Brooke
- Promenade Plan at Salem Brooke
- Portico Plan at Salem Brooke
- 6049 Frye Bridge Rd
- 5246 Sunny Brook Ct
- 5245 Quail Forest Dr
- 6219 Finch Meadow Ct
- 5161 Quail Forest Dr
- 6039 Sunny Brook Dr
- 6112 Charlene Dr
- 165 Stonburg Rd
- 0 Hampton Rd
- 4915 Salem Glen Blvd
- 4932 Britton Gardens Rd
- 4940 Britton Gardens Rd
- 4916 Britton Gardens Rd
- 4948 Britton Gardens Rd
- 4908 Britton Gardens Rd
- 4954 Britton Gardens Rd
- 4960 Britton Gardens Rd
- 4957 Autumnwood Ct
- 4931 Britton Gardens Rd
- 4923 Britton Gardens Rd
- 4939 Britton Gardens Rd
- 8290 Arbor Ridge Ln
- 4968 Britton Gardens Rd
- 4947 Britton Gardens Rd
- 4995 Dock Davis Rd
- 4953 Britton Gardens Rd
- 4959 Britton Gardens Rd
- 4989 Dock Davis Rd
- 4976 Britton Gardens Rd