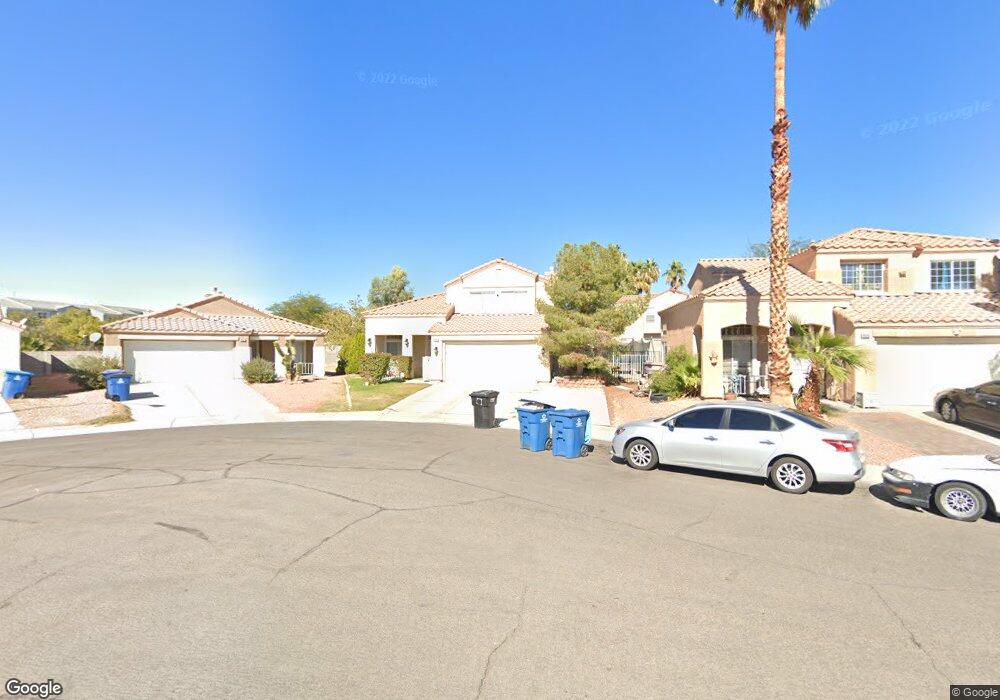
4911 Via Luis Ct North Las Vegas, NV 89031
Craig Ranch NeighborhoodEstimated Value: $387,000 - $409,906
3
Beds
3
Baths
1,496
Sq Ft
$265/Sq Ft
Est. Value
About This Home
This home is located at 4911 Via Luis Ct, North Las Vegas, NV 89031 and is currently estimated at $396,227, approximately $264 per square foot. 4911 Via Luis Ct is a home located in Clark County with nearby schools including Raul P. Elizondo Elementary School, Clifford O. Findlay Middle School, and Mojave High School.
Ownership History
Date
Name
Owned For
Owner Type
Purchase Details
Closed on
Jun 24, 2009
Sold by
Richardson Vincent and Richardson Vincent L
Bought by
Richardson Vincent
Current Estimated Value
Home Financials for this Owner
Home Financials are based on the most recent Mortgage that was taken out on this home.
Original Mortgage
$175,913
Outstanding Balance
$111,503
Interest Rate
4.83%
Mortgage Type
VA
Estimated Equity
$284,724
Purchase Details
Closed on
Mar 19, 2008
Sold by
Wells Fargo Bank Na
Bought by
Richardson Vincent L
Home Financials for this Owner
Home Financials are based on the most recent Mortgage that was taken out on this home.
Original Mortgage
$173,655
Interest Rate
5.65%
Mortgage Type
VA
Purchase Details
Closed on
Jul 25, 2007
Sold by
Mount Thomas M and Mount Brenda S
Bought by
Wells Fargo Bank Na
Purchase Details
Closed on
Jun 28, 1995
Sold by
Kaufman & Broad Of Nevada Inc
Bought by
Mount Thomas M and Mount Brenda S
Home Financials for this Owner
Home Financials are based on the most recent Mortgage that was taken out on this home.
Original Mortgage
$111,248
Interest Rate
7.88%
Mortgage Type
FHA
Create a Home Valuation Report for This Property
The Home Valuation Report is an in-depth analysis detailing your home's value as well as a comparison with similar homes in the area
Home Values in the Area
Average Home Value in this Area
Purchase History
| Date | Buyer | Sale Price | Title Company |
|---|---|---|---|
| Richardson Vincent | -- | Lawyers Title Of Nevada West | |
| Richardson Vincent L | $170,000 | Equity Title Of Nevada | |
| Wells Fargo Bank Na | $214,014 | Accommodation | |
| Mount Thomas M | $113,000 | Nevada Title Company |
Source: Public Records
Mortgage History
| Date | Status | Borrower | Loan Amount |
|---|---|---|---|
| Open | Richardson Vincent | $175,913 | |
| Closed | Richardson Vincent L | $173,655 | |
| Previous Owner | Mount Thomas M | $111,248 |
Source: Public Records
Tax History Compared to Growth
Tax History
| Year | Tax Paid | Tax Assessment Tax Assessment Total Assessment is a certain percentage of the fair market value that is determined by local assessors to be the total taxable value of land and additions on the property. | Land | Improvement |
|---|---|---|---|---|
| 2025 | $1,258 | $94,717 | $30,100 | $64,617 |
| 2024 | $1,222 | $94,717 | $30,100 | $64,617 |
| 2023 | $1,222 | $89,214 | $28,000 | $61,214 |
| 2022 | $1,187 | $78,390 | $22,050 | $56,340 |
| 2021 | $1,152 | $74,736 | $21,000 | $53,736 |
| 2020 | $1,116 | $73,313 | $19,950 | $53,363 |
| 2019 | $1,083 | $68,077 | $15,400 | $52,677 |
| 2018 | $1,052 | $63,224 | $12,250 | $50,974 |
| 2017 | $1,985 | $59,175 | $10,850 | $48,325 |
| 2016 | $997 | $52,503 | $8,400 | $44,103 |
| 2015 | $994 | $40,846 | $5,950 | $34,896 |
| 2014 | $965 | $30,032 | $4,900 | $25,132 |
Source: Public Records
Map
Nearby Homes
- 4915 Via Luis Ct
- 5038 Vista Del Rio Way
- 908 Cypress Gold Ct
- 4822 Con Carne Ct
- 3601 Allen Creek Ct
- 524 Rancho Del Sol Way
- 4784 Wild Draw Dr
- 4762 Wild Draw Dr
- 5243 Edna Crane Ave
- 4744 Big Draw Dr
- 5243 Willowdale Ct
- 1132 Turnstone Ct
- 5136 Stonecrop St
- 5045 Bayberry Crest St
- 1038 Solemn Cactus Ave
- 4752 Cactus Sun Ln
- 13 Deseo Ct
- 1213 Stonesthrow Cir
- 921 Evening Fawn Dr
- 4606 Pointleaf St
- 4907 Via Luis Ct
- 615 Rancho Del Norte Dr
- 611 Rancho Del Norte Dr
- 4903 Via Luis Ct
- 619 Rancho Del Norte Dr
- 607 Rancho Del Norte Dr
- 623 Rancho Del Norte Dr
- 4919 Via Luis Ct
- 603 Rancho Del Norte Dr
- 4902 Via Luis Ct
- 627 Rancho Del Norte Dr
- 4933 Via Luis Ct
- 4910 Via Luis Ct
- 4910 Via Luis Ct Unit HOUSE
- 4914 Via Luis Ct
- 4906 Via Luis Ct
- 4937 Via Luis Ct
- 4918 Via Luis Ct
- 702 Rancho Del Norte Dr
- 612 Rancho Del Norte Dr