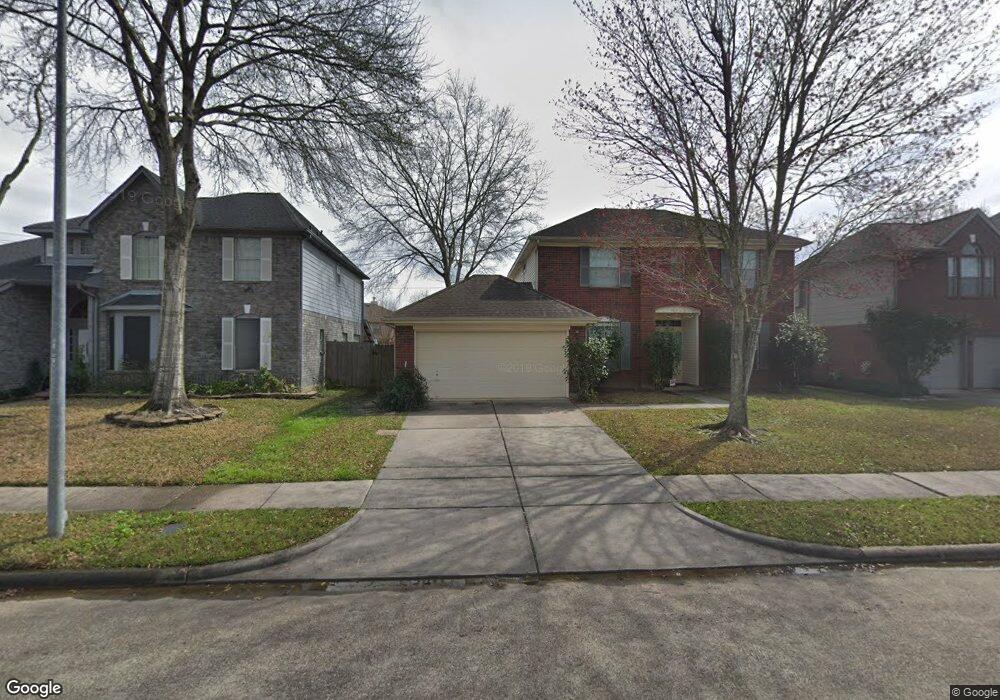
4911 Widerop Ln Friendswood, TX 77546
Heritage Park NeighborhoodEstimated Value: $296,658 - $322,000
3
Beds
3
Baths
1,848
Sq Ft
$169/Sq Ft
Est. Value
About This Home
This home is located at 4911 Widerop Ln, Friendswood, TX 77546 and is currently estimated at $311,665, approximately $168 per square foot. 4911 Widerop Ln is a home located in Harris County with nearby schools including Wedgewood Elementary School, Brookside Intermediate School, and Clear Brook High School.
Ownership History
Date
Name
Owned For
Owner Type
Purchase Details
Closed on
Jun 2, 2000
Sold by
Kelly Kelsey A and Kelly Erin T
Bought by
Vanpham Kim and Bui Bich Ngan
Current Estimated Value
Home Financials for this Owner
Home Financials are based on the most recent Mortgage that was taken out on this home.
Original Mortgage
$100,000
Outstanding Balance
$34,013
Interest Rate
8.13%
Estimated Equity
$277,652
Purchase Details
Closed on
Jun 29, 1999
Sold by
Watson Ruth G
Bought by
Kelly Kelsey A and Kelly Erin T
Home Financials for this Owner
Home Financials are based on the most recent Mortgage that was taken out on this home.
Original Mortgage
$92,800
Interest Rate
7.21%
Purchase Details
Closed on
Oct 23, 1997
Sold by
Fifer Frank V and Fifer Diana
Bought by
Watson Ruth G
Home Financials for this Owner
Home Financials are based on the most recent Mortgage that was taken out on this home.
Original Mortgage
$66,400
Interest Rate
7.33%
Create a Home Valuation Report for This Property
The Home Valuation Report is an in-depth analysis detailing your home's value as well as a comparison with similar homes in the area
Home Values in the Area
Average Home Value in this Area
Purchase History
| Date | Buyer | Sale Price | Title Company |
|---|---|---|---|
| Vanpham Kim | -- | Alamo Title 23 | |
| Kelly Kelsey A | -- | First American Title | |
| Watson Ruth G | -- | -- |
Source: Public Records
Mortgage History
| Date | Status | Borrower | Loan Amount |
|---|---|---|---|
| Open | Vanpham Kim | $100,000 | |
| Previous Owner | Kelly Kelsey A | $92,800 | |
| Previous Owner | Watson Ruth G | $66,400 | |
| Closed | Kelly Kelsey A | $11,600 |
Source: Public Records
Tax History Compared to Growth
Tax History
| Year | Tax Paid | Tax Assessment Tax Assessment Total Assessment is a certain percentage of the fair market value that is determined by local assessors to be the total taxable value of land and additions on the property. | Land | Improvement |
|---|---|---|---|---|
| 2025 | $1,585 | $296,522 | $60,471 | $236,051 |
| 2024 | $1,585 | $278,079 | $60,471 | $217,608 |
| 2023 | $1,585 | $311,668 | $60,471 | $251,197 |
| 2022 | $5,135 | $264,333 | $60,471 | $203,862 |
| 2021 | $4,932 | $227,691 | $46,149 | $181,542 |
| 2020 | $4,862 | $208,961 | $38,192 | $170,769 |
| 2019 | $4,984 | $204,652 | $36,601 | $168,051 |
| 2018 | $953 | $187,451 | $33,418 | $154,033 |
| 2017 | $4,446 | $182,554 | $33,418 | $149,136 |
| 2016 | $4,155 | $170,613 | $30,236 | $140,377 |
| 2015 | $2,998 | $157,880 | $23,870 | $134,010 |
| 2014 | $2,998 | $143,313 | $23,870 | $119,443 |
Source: Public Records
Map
Nearby Homes
- 4902 Quiet Canyon Dr
- 16050 Cedar Gully Dr
- 16327 Blackhawk Blvd
- 16406 Blackhawk Blvd
- 16114 Arborlea Dr
- 5202 Apple Blossom Ln
- 16222 Forest Bend Ave
- 16114 Forest Bend Ave
- 16510 Blackhawk Blvd
- 15818 Wandering Trail
- 5131 Shady Oaks Ln
- 16039 Surrey Woods Dr
- 3727 Norwood Glen Ln
- 15719 Bougainvilla Ln
- 16715 Frigate Dr
- 16303 Townes Rd
- 15819 Saint Lawrence Cir
- 4930 Heritage Plains Dr
- 16922 Echo Harbor
- 5323 Abercreek Ave
- 4915 Widerop Ln
- 4907 Widerop Ln
- 16207 Quiet Canyon Ct
- 4903 Widerop Ln
- 4919 Widerop Ln
- 16203 Quiet Canyon Ct
- 4910 Widerop Ln
- 4906 Widerop Ln
- 16211 Quiet Canyon Ct
- 4914 Quiet Canyon Dr
- 4823 Widerop Ln
- 4923 Widerop Ln
- 4902 Widerop Ln
- 16202 Quiet Canyon Ct
- 4918 Widerop Ln
- 4822 Widerop Ln
- 4819 Widerop Ln
- 4910 Quiet Canyon Dr
- 16211 Leigh Canyon Dr
- 4927 Widerop Ln