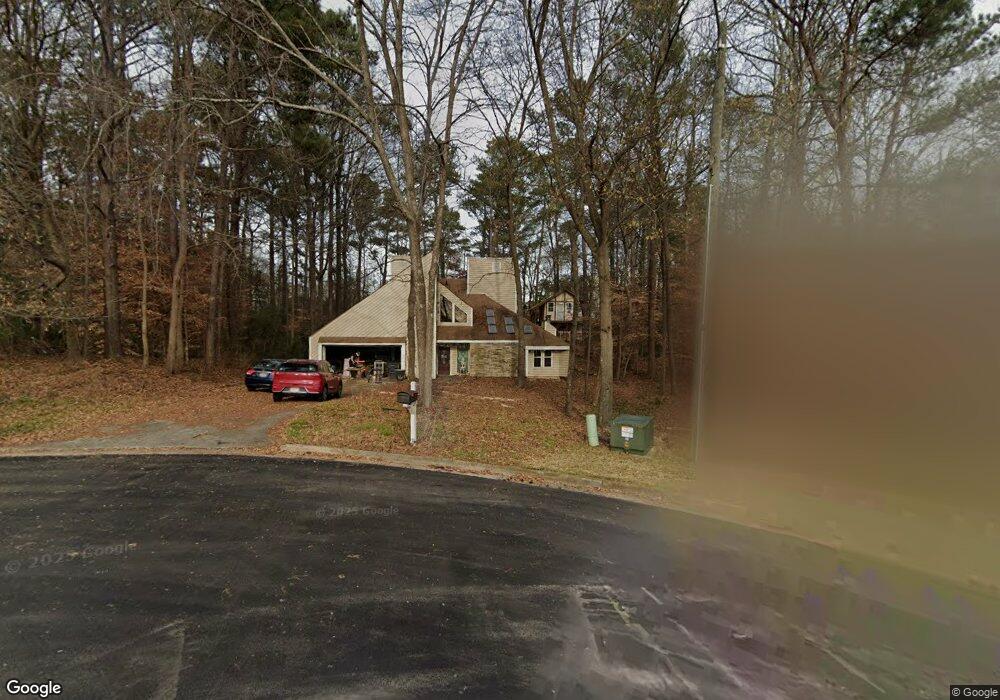
4912 Olaughlin Ct SW Unit 2/49 Mableton, GA 30126
Estimated Value: $337,000 - $407,000
3
Beds
3
Baths
1,840
Sq Ft
$204/Sq Ft
Est. Value
About This Home
This home is located at 4912 Olaughlin Ct SW Unit 2/49, Mableton, GA 30126 and is currently estimated at $375,388, approximately $204 per square foot. 4912 Olaughlin Ct SW Unit 2/49 is a home located in Cobb County with nearby schools including Mableton Elementary School, Floyd Middle School, and Covered Bridge Academy.
Ownership History
Date
Name
Owned For
Owner Type
Purchase Details
Closed on
Apr 7, 2016
Sold by
Naysay Music Llc
Bought by
French Daniel
Current Estimated Value
Home Financials for this Owner
Home Financials are based on the most recent Mortgage that was taken out on this home.
Original Mortgage
$194,370
Outstanding Balance
$153,996
Interest Rate
3.68%
Mortgage Type
New Conventional
Estimated Equity
$221,392
Purchase Details
Closed on
Sep 21, 2015
Sold by
Myers Tammy L
Bought by
Naysay Music Llc
Home Financials for this Owner
Home Financials are based on the most recent Mortgage that was taken out on this home.
Original Mortgage
$126,000
Interest Rate
3.97%
Mortgage Type
New Conventional
Purchase Details
Closed on
Jul 23, 2015
Sold by
Queen Jack D
Bought by
Myers Tammy L
Home Financials for this Owner
Home Financials are based on the most recent Mortgage that was taken out on this home.
Original Mortgage
$126,000
Interest Rate
3.97%
Mortgage Type
New Conventional
Create a Home Valuation Report for This Property
The Home Valuation Report is an in-depth analysis detailing your home's value as well as a comparison with similar homes in the area
Home Values in the Area
Average Home Value in this Area
Purchase History
| Date | Buyer | Sale Price | Title Company |
|---|---|---|---|
| French Daniel | $204,600 | -- | |
| Naysay Music Llc | $64,000 | -- | |
| Myers Tammy L | $117,550 | -- |
Source: Public Records
Mortgage History
| Date | Status | Borrower | Loan Amount |
|---|---|---|---|
| Open | French Daniel | $194,370 | |
| Previous Owner | Naysay Music Llc | $126,000 |
Source: Public Records
Tax History Compared to Growth
Tax History
| Year | Tax Paid | Tax Assessment Tax Assessment Total Assessment is a certain percentage of the fair market value that is determined by local assessors to be the total taxable value of land and additions on the property. | Land | Improvement |
|---|---|---|---|---|
| 2025 | $4,042 | $134,148 | $34,000 | $100,148 |
| 2024 | $4,045 | $134,148 | $34,000 | $100,148 |
| 2023 | $3,817 | $126,584 | $20,000 | $106,584 |
| 2022 | $3,378 | $111,304 | $20,000 | $91,304 |
| 2021 | $2,978 | $98,112 | $18,800 | $79,312 |
| 2020 | $2,978 | $98,112 | $18,800 | $79,312 |
| 2019 | $2,551 | $84,048 | $18,000 | $66,048 |
| 2018 | $2,509 | $82,672 | $16,000 | $66,672 |
| 2017 | $2,226 | $77,428 | $16,000 | $61,428 |
| 2016 | $735 | $25,564 | $5,444 | $20,120 |
| 2015 | $1,385 | $47,020 | $10,000 | $37,020 |
| 2014 | $1,397 | $47,020 | $0 | $0 |
Source: Public Records
Map
Nearby Homes
- 647 Shannon Green Cir SW
- 221 Shady Ln SW
- 450 Dorset Way SW
- 4800 Timberland Dr SW
- 26 Flint Ridge Dr SE
- 680 Sundial Ln
- 684 Sundial Ln
- 414 Landers Dr SW Unit 1
- 637 Carlouetta Rd SW
- Jasper-Townhome Plan at Park View Reserve - Hometown Series
- Madeline-Townhome Plan at Park View Reserve - Hometown Series
- 187 Fontaine Rd SW
- 188 Covered Bridge Trail SW
- 35 Dunaire Ct SW
- 470 Pineland Rd SW
- 639 Concord Rd SW
- 4672 Vernon Dr SW
- 4912 Olaughlin Ct SW
- 4916 Olaughlin Ct SW
- 0 Olaughlin Ct SW Unit 8457648
- 0 Olaughlin Ct SW Unit 8344523
- 345 Nickajack Rd SW
- 4915 Olaughlin Ct SW
- 4920 Olaughlin Ct SW
- 4897 Oflaherty Ct SW
- 4897 Oflaherty Court Sw 0
- 4903 Oflaherty Ct SW
- 365 Nickajack Rd SW
- 4893 Oflaherty Ct SW
- 4921 Olaughlin Ct SW Unit 2
- 4909 Oflaherty Ct SW
- 385 Nickajack Rd SW
- 333 Nickajack Rd SW
- 4915 Oflaherty Ct SW
- 392 Saint Patrick Dr SW
- 405 Nickajack Rd SW
- 380 Saint Patrick Dr SW Unit 2