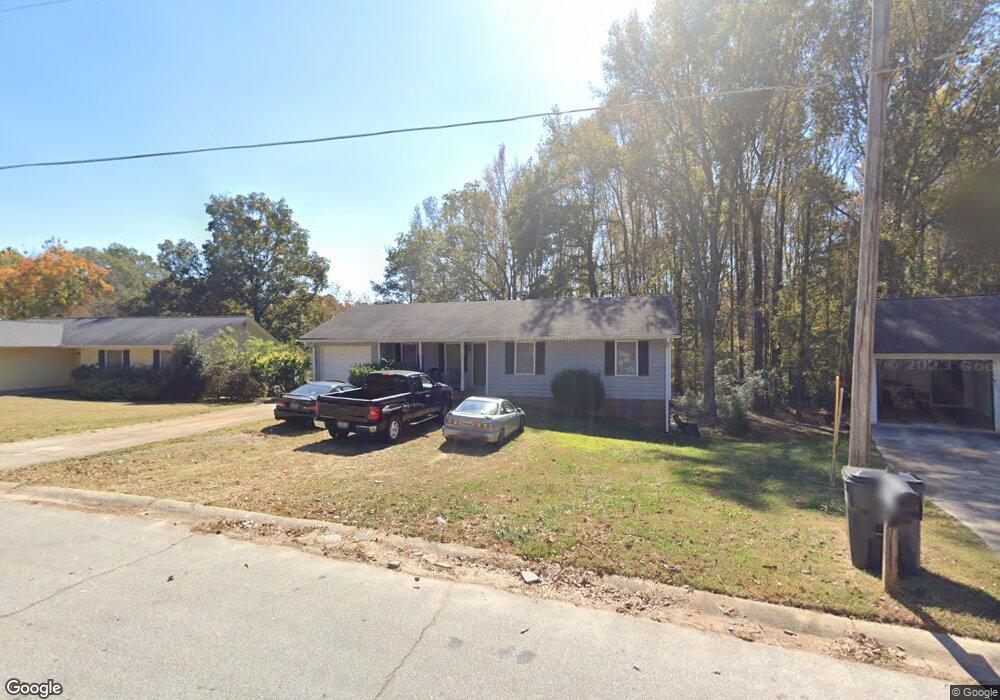
4913 Cherokee Way SE Conyers, GA 30094
Estimated Value: $202,000 - $219,000
3
Beds
2
Baths
1,228
Sq Ft
$172/Sq Ft
Est. Value
About This Home
This home is located at 4913 Cherokee Way SE, Conyers, GA 30094 and is currently estimated at $211,007, approximately $171 per square foot. 4913 Cherokee Way SE is a home located in Rockdale County with nearby schools including Barksdale Elementary School, Gen. Ray Davis Middle School, and Salem High School.
Ownership History
Date
Name
Owned For
Owner Type
Purchase Details
Closed on
Jul 10, 2019
Sold by
Srp Sub Llc
Bought by
Sunfire 2 Llc
Current Estimated Value
Purchase Details
Closed on
May 9, 2017
Sold by
Not Provided
Bought by
Srp Sub Llc
Purchase Details
Closed on
Jun 16, 2014
Sold by
Srp Sub Llc
Bought by
Tarbert Llc
Purchase Details
Closed on
Aug 6, 2013
Sold by
Carlisle Rex Boise
Bought by
Srp Sub Llc
Purchase Details
Closed on
Nov 4, 2009
Sold by
Coleman Realty Group Inc
Bought by
4913 Cherokee Way Trust
Purchase Details
Closed on
Sep 1, 2009
Sold by
Carlisle Rex B and Carlisle Susan G
Bought by
Coleman Realty Group Inc
Purchase Details
Closed on
May 17, 1994
Sold by
T W Prop Inc
Bought by
Carlisle Rex Susan
Home Financials for this Owner
Home Financials are based on the most recent Mortgage that was taken out on this home.
Original Mortgage
$68,300
Interest Rate
8.48%
Mortgage Type
VA
Create a Home Valuation Report for This Property
The Home Valuation Report is an in-depth analysis detailing your home's value as well as a comparison with similar homes in the area
Home Values in the Area
Average Home Value in this Area
Purchase History
| Date | Buyer | Sale Price | Title Company |
|---|---|---|---|
| Sunfire 2 Llc | $102,836 | -- | |
| Srp Sub Llc | -- | -- | |
| Tarbert Llc | -- | -- | |
| Srp Sub Llc | $32,609 | -- | |
| 4913 Cherokee Way Trust | $78,100 | -- | |
| Coleman Realty Group Inc | $15,000 | -- | |
| Carlisle Rex Susan | $67,000 | -- |
Source: Public Records
Mortgage History
| Date | Status | Borrower | Loan Amount |
|---|---|---|---|
| Previous Owner | Carlisle Rex Susan | $68,300 |
Source: Public Records
Tax History Compared to Growth
Tax History
| Year | Tax Paid | Tax Assessment Tax Assessment Total Assessment is a certain percentage of the fair market value that is determined by local assessors to be the total taxable value of land and additions on the property. | Land | Improvement |
|---|---|---|---|---|
| 2024 | $2,346 | $57,240 | $7,280 | $49,960 |
| 2023 | $2,390 | $56,920 | $7,000 | $49,920 |
| 2022 | $2,255 | $53,520 | $7,000 | $46,520 |
| 2021 | $1,923 | $45,760 | $6,600 | $39,160 |
| 2020 | $1,712 | $39,760 | $5,920 | $33,840 |
| 2019 | $1,545 | $34,040 | $4,960 | $29,080 |
| 2018 | $1,233 | $26,960 | $4,440 | $22,520 |
| 2017 | $1,082 | $23,400 | $3,480 | $19,920 |
| 2016 | $949 | $20,480 | $3,160 | $17,320 |
| 2015 | $912 | $19,640 | $2,320 | $17,320 |
| 2014 | $921 | $19,640 | $2,320 | $17,320 |
| 2013 | -- | $26,240 | $3,880 | $22,360 |
Source: Public Records
Map
Nearby Homes
- 4822 Navajo Trail SE
- 4824 Georgia 20
- 821 Greenwood Trail SE
- 4710 Cedar Brook Dr SE
- 4773 Bell Cir SE
- 824 Cedar Lake Dr SE
- 4670 Cedar Brook Dr SE
- 801 Greenwood Trail SE
- 926 Bell Rd SE
- 1120 Kinnett Rd
- 1020 Thornwood Cir
- 14908 Brown Bridge Rd
- 14845 Brown Bridge Rd
- 634 Knollwood Cir SE
- 5312 Ashley Dr SE
- 4938 Lake Forest Dr SE
- 2178 NE Hillwood Dr
- 604 Hamlet Ct SE
- 4913 Cherokee Way SE
- 4911 Cherokee Way SE
- 4917 Cherokee Way SE
- 4919 Cherokee Way SE
- 4909 Cherokee Way SE Unit 2
- 4912 Cherokee Way SE
- 4916 Cherokee Way SE
- 4916 Cherokee Way SE
- 4908 Cherokee Way SE
- 4905 Cherokee Way SE
- 4915 Cherokee Way SE
- 4905 Highway 20 S Unit 1
- 4899 Cherokee Way SE
- 5061 Highway 20 S
- 807 Navajo Ct SE
- 4895 Highway 20 SE
- 4895 Highway 20 S Unit 1
- 935 Cherokee Ct SE
- 4875 Highway 20 S
- 4891 Cherokee Way SE