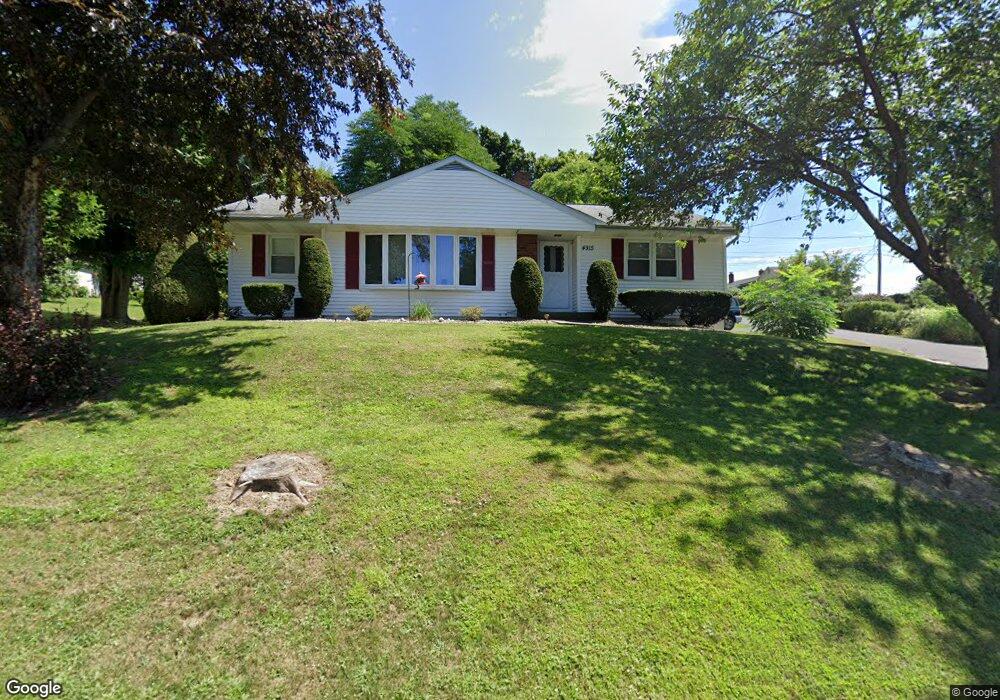
4913 Highland Park Ave Unit 19 Altoona, PA 16602
Highland Park NeighborhoodEstimated Value: $175,000 - $223,000
--
Bed
--
Bath
1,114
Sq Ft
$184/Sq Ft
Est. Value
About This Home
This home is located at 4913 Highland Park Ave Unit 19, Altoona, PA 16602 and is currently estimated at $204,834, approximately $183 per square foot. 4913 Highland Park Ave Unit 19 is a home located in Blair County with nearby schools including Harbor House Preschool & Kindergarten, Bishop Guilfoyle Academy, and Holy Trinity Middle School Campus.
Ownership History
Date
Name
Owned For
Owner Type
Purchase Details
Closed on
Oct 3, 2019
Sold by
Sukala John J
Bought by
Bender Jared M and Altiero Kaitlin N
Current Estimated Value
Home Financials for this Owner
Home Financials are based on the most recent Mortgage that was taken out on this home.
Original Mortgage
$98,800
Outstanding Balance
$86,554
Interest Rate
3.5%
Mortgage Type
New Conventional
Estimated Equity
$118,280
Purchase Details
Closed on
Nov 25, 2008
Sold by
Louder Charles R
Bought by
Sukala John J
Home Financials for this Owner
Home Financials are based on the most recent Mortgage that was taken out on this home.
Original Mortgage
$62,550
Interest Rate
6.03%
Mortgage Type
New Conventional
Purchase Details
Closed on
Nov 24, 2008
Sold by
Louder Charles P
Bought by
Sukala John J
Home Financials for this Owner
Home Financials are based on the most recent Mortgage that was taken out on this home.
Original Mortgage
$62,550
Interest Rate
6.03%
Mortgage Type
New Conventional
Create a Home Valuation Report for This Property
The Home Valuation Report is an in-depth analysis detailing your home's value as well as a comparison with similar homes in the area
Home Values in the Area
Average Home Value in this Area
Purchase History
| Date | Buyer | Sale Price | Title Company |
|---|---|---|---|
| Bender Jared M | $104,000 | Abstract Closing Svcs Llc | |
| Sukala John J | -- | None Available | |
| Sukala John J | $69,500 | None Available |
Source: Public Records
Mortgage History
| Date | Status | Borrower | Loan Amount |
|---|---|---|---|
| Open | Bender Jared M | $98,800 | |
| Previous Owner | Sukala John J | $62,550 |
Source: Public Records
Tax History Compared to Growth
Tax History
| Year | Tax Paid | Tax Assessment Tax Assessment Total Assessment is a certain percentage of the fair market value that is determined by local assessors to be the total taxable value of land and additions on the property. | Land | Improvement |
|---|---|---|---|---|
| 2025 | $2,237 | $117,100 | $30,000 | $87,100 |
| 2024 | $1,979 | $117,100 | $30,000 | $87,100 |
| 2023 | $1,727 | $0 | $0 | $0 |
| 2022 | $1,702 | $110,300 | $30,000 | $80,300 |
| 2021 | $1,702 | $110,300 | $30,000 | $80,300 |
| 2020 | $1,700 | $110,300 | $30,000 | $80,300 |
| 2019 | $1,661 | $110,300 | $30,000 | $80,300 |
| 2018 | $1,614 | $110,300 | $30,000 | $80,300 |
| 2017 | $6,978 | $110,300 | $30,000 | $80,300 |
| 2016 | $234 | $7,300 | $1,500 | $5,800 |
| 2015 | $234 | $7,300 | $1,500 | $5,800 |
| 2014 | $234 | $7,300 | $1,500 | $5,800 |
Source: Public Records
Map
Nearby Homes
- 5001 Highland Park Ave Unit 5
- 516 49th St
- 530 52nd St Unit 32
- 4607 Lyndale Rd
- 316 Ridge Ave
- 5418 5th Ave
- 305 Ridge Ave
- 5029 Kissell Ave
- 4221-4231 4th Ave
- 703 Ruskin Dr
- 5016 Beale Ave
- 201 Ruskin Dr
- 813 58th St
- 213 Milton Ave
- 109 Ruskin Dr
- 5813 Beale Ave Unit 15
- 205 Milton Ave
- - Goods Ln
- 931 Veterans Memorial Hwy
- 304 Shelley Ave
- 4909 Highland Park Ave Unit 11
- 509 50th St Unit 15
- 526 50th St Unit 34
- 508 50th St Unit 14
- 530 50th St
- 4901 Highland Park Ave Unit 7
- 5007 Highland Park Ave Unit 11
- 4900 Highland Park Ave
- 527 49th St Unit 33
- 507 49th St Unit 13
- 536 50th St
- 500 50th St Unit 2
- 501 50th St Unit 7
- 547 50th St Unit 51
- 520 49th St Unit 24
- 535-41 50th St
- 5017 Highland Park Ave Unit 19
- 5017 Highland Park Ave
- 526 49th St Unit 28
- 508 51st St Unit 14