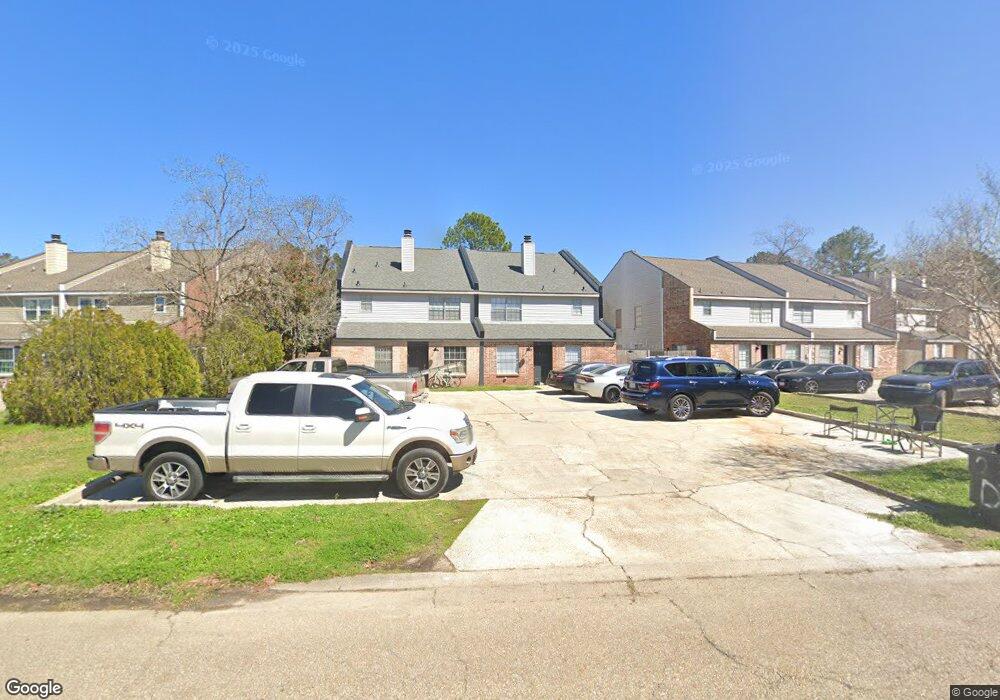
4913 Kennesaw Dr Unit 1-4 Baton Rouge, LA 70817
Shenandoah NeighborhoodEstimated Value: $389,000 - $411,000
20
Beds
8
Baths
3,858
Sq Ft
$104/Sq Ft
Est. Value
About This Home
This home is located at 4913 Kennesaw Dr Unit 1-4, Baton Rouge, LA 70817 and is currently estimated at $399,946, approximately $103 per square foot. 4913 Kennesaw Dr Unit 1-4 is a home located in East Baton Rouge Parish with nearby schools including Shenandoah Elementary School, Woodlawn Middle School, and Woodlawn High School.
Ownership History
Date
Name
Owned For
Owner Type
Purchase Details
Closed on
Dec 20, 2024
Sold by
Yocom Morgan
Bought by
Mojo Props Llc
Current Estimated Value
Home Financials for this Owner
Home Financials are based on the most recent Mortgage that was taken out on this home.
Original Mortgage
$391,773
Outstanding Balance
$388,692
Interest Rate
6.79%
Mortgage Type
New Conventional
Estimated Equity
$11,254
Purchase Details
Closed on
Feb 21, 2022
Sold by
Jebara Joseph K and Jebara Morgan L
Bought by
Mojo Props Llc
Home Financials for this Owner
Home Financials are based on the most recent Mortgage that was taken out on this home.
Original Mortgage
$348,795
Interest Rate
3.55%
Mortgage Type
New Conventional
Purchase Details
Closed on
Dec 15, 2021
Sold by
Thomco Llc
Bought by
Jebara Joseph K
Create a Home Valuation Report for This Property
The Home Valuation Report is an in-depth analysis detailing your home's value as well as a comparison with similar homes in the area
Home Values in the Area
Average Home Value in this Area
Purchase History
| Date | Buyer | Sale Price | Title Company |
|---|---|---|---|
| Mojo Props Llc | -- | None Listed On Document | |
| Rodrigues Dwayne Lee | $399,000 | Louisiana Title | |
| Mojo Props Llc | -- | None Listed On Document | |
| Jebara Joseph K | $270,000 | None Available |
Source: Public Records
Mortgage History
| Date | Status | Borrower | Loan Amount |
|---|---|---|---|
| Open | Rodrigues Dwayne Lee | $391,773 | |
| Previous Owner | Mojo Props Llc | $348,795 |
Source: Public Records
Tax History Compared to Growth
Tax History
| Year | Tax Paid | Tax Assessment Tax Assessment Total Assessment is a certain percentage of the fair market value that is determined by local assessors to be the total taxable value of land and additions on the property. | Land | Improvement |
|---|---|---|---|---|
| 2024 | $3,126 | $27,000 | $500 | $26,500 |
| 2023 | $3,126 | $25,650 | $500 | $25,150 |
| 2022 | $2,909 | $25,650 | $500 | $25,150 |
| 2021 | $2,919 | $26,250 | $500 | $25,750 |
| 2020 | $2,957 | $26,250 | $500 | $25,750 |
| 2019 | $2,434 | $20,700 | $500 | $20,200 |
| 2018 | $2,403 | $20,700 | $500 | $20,200 |
| 2017 | $2,403 | $20,700 | $500 | $20,200 |
| 2016 | $2,341 | $20,700 | $500 | $20,200 |
| 2015 | $1,950 | $17,200 | $500 | $16,700 |
| 2014 | $1,909 | $17,200 | $500 | $16,700 |
| 2013 | -- | $17,200 | $500 | $16,700 |
Source: Public Records
Map
Nearby Homes
- 4830 Kennesaw Dr Unit A
- Lot 41A Carnifix Ct
- 16225 Chadsford Ave
- 16067 Chantilly Ave
- 5111 Paducah Ct
- 5101 Paducah Ct
- 15844 Chantilly Ave
- 16039 Haynes Bluff Ave
- 16849 Monitor Ave
- 16756 Merrimac Ave
- 16825 Chadsford Ave
- 16103 Knoll Creek Ave
- 15946 Ferrell Ave
- 5138 Cumberland Cove Dr
- 5136 Cumberland Cove Dr
- 4036 Copperridge Dr
- 5315 Sleepy Hollow Dr
- 15725 Springwood Ave
- 17440 Beachwood Ave
- 17237 Monitor Ave
- 4923 Kennesaw Dr Unit A
- 4923 Kennesaw Dr
- 4923 Kennesaw Dr Unit 1-4
- 4841 Kennesaw Dr
- 4912 Kennesaw Dr
- 4821 Kennesaw Dr
- 4821 Kennesaw Dr Unit D
- 16633 Missionary Ridge Ct Unit D
- 16633 Missionary Ridge Ct Unit A
- 4840 Kennesaw Dr
- 16545 Missionary Ridge Ave
- 16643 Missionary Ridg
- 16643 Missionary Ridge Ct Unit 1-4
- 16524 George Oneal Rd
- 16524 George Oneal Rd Unit C
- 4807 Kennesaw Dr Unit 1-4
- 5105 Kennesaw Dr
- 16535 Missionary Ridge Ave
- 16536 Missionary Ridge Ct
- 16534 George Oneal Rd