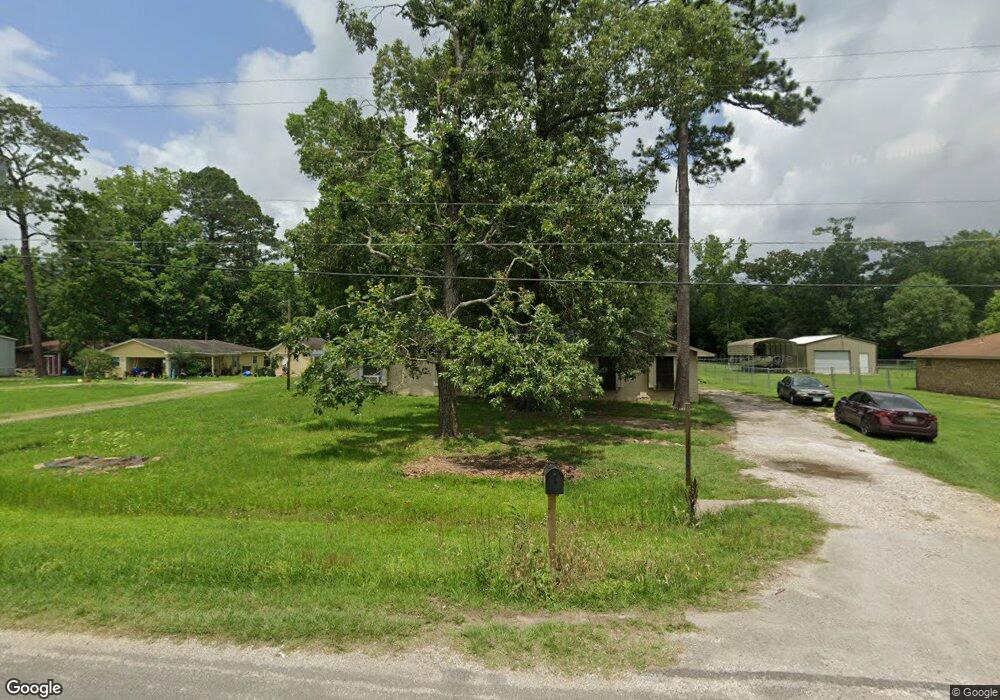
4913 Magnolia Ln Old River-Winfree, TX 77535
Estimated Value: $295,069 - $398,000
--
Bed
--
Bath
2,256
Sq Ft
$150/Sq Ft
Est. Value
About This Home
This home is located at 4913 Magnolia Ln, Old River-Winfree, TX 77535 and is currently estimated at $339,517, approximately $150 per square foot. 4913 Magnolia Ln is a home located in Chambers County with nearby schools including Kimmie M. Brown Elementary School, Austin Elementary School, and Richter Elementary School.
Ownership History
Date
Name
Owned For
Owner Type
Purchase Details
Closed on
Aug 16, 2022
Sold by
Fanning Jana D
Bought by
Cunningham Garrett
Current Estimated Value
Purchase Details
Closed on
Sep 24, 2020
Sold by
Fanning Jason
Bought by
Fanning Jana D
Purchase Details
Closed on
Mar 14, 2019
Sold by
Bank Frost and The Jason Fanning Section 142
Bought by
Fanning Jason
Purchase Details
Closed on
May 16, 2013
Sold by
Fanning Jason
Bought by
Frost Bank and The Jason Fanning Section 142 Trust
Purchase Details
Closed on
Dec 16, 2010
Sold by
Fanning Jane
Bought by
Fanning Jason
Purchase Details
Closed on
Sep 13, 2007
Sold by
Hsbc Bank Usa Na
Bought by
Fanning Jane and Fanning Wendell
Purchase Details
Closed on
Jun 21, 2004
Sold by
Fincher Eddie and Fincher Stacey
Bought by
Wilshire Credit Corp
Create a Home Valuation Report for This Property
The Home Valuation Report is an in-depth analysis detailing your home's value as well as a comparison with similar homes in the area
Home Values in the Area
Average Home Value in this Area
Purchase History
| Date | Buyer | Sale Price | Title Company |
|---|---|---|---|
| Cunningham Garrett | -- | None Listed On Document | |
| Fanning Jana D | -- | None Available | |
| Fanning Jason | -- | None Available | |
| Frost Bank | -- | None Available | |
| Fanning Jason | -- | None Available | |
| Fanning Jane | -- | Lsi Title Agency Inc | |
| Wilshire Credit Corp | $75,600 | None Available |
Source: Public Records
Tax History Compared to Growth
Tax History
| Year | Tax Paid | Tax Assessment Tax Assessment Total Assessment is a certain percentage of the fair market value that is determined by local assessors to be the total taxable value of land and additions on the property. | Land | Improvement |
|---|---|---|---|---|
| 2025 | $4,589 | $298,440 | $13,170 | $285,270 |
| 2024 | $42 | $269,090 | $13,170 | $255,920 |
| 2023 | $3,908 | $250,630 | $13,170 | $237,460 |
| 2022 | $3,968 | $239,610 | $13,170 | $226,440 |
| 2021 | $4,087 | $239,610 | $13,170 | $226,440 |
| 2020 | $4,087 | $239,610 | $13,170 | $226,440 |
| 2019 | $3,887 | $206,060 | $13,170 | $192,890 |
| 2018 | $2,740 | $206,060 | $13,170 | $192,890 |
| 2017 | $3,027 | $159,300 | $13,170 | $146,130 |
| 2016 | $2,665 | $140,240 | $13,170 | $127,070 |
| 2015 | $772 | $140,240 | $13,170 | $127,070 |
| 2014 | $772 | $140,240 | $13,170 | $127,070 |
Source: Public Records
Map
Nearby Homes
- 4902 Magnolia Ln
- 4925 Magnolia Ln
- 4922 Blackberry Ln
- 5002 Blackberry Ln
- 93 County Road 4020
- 243 Ice Shore Trail
- 400 County Road 4023
- 78 County Road 4021a
- 13015 Timberridge Dr
- 0 Farm To Market Road 1409
- 000 Farm To Market Road 1409
- 0 Reeves Cemetary Rd
- 582 County Road 410
- 13743 Fm 1409
- 13236 Fm 1409 Unit A
- 6107 N Farm To Market 565 Rd
- 12807 Old River Dr
- 133 County Road 4111
- 94 County Road 4111
- 5511 Carriage Trails Dr
- 4913 Magnolia Ln
- 4917 Magnolia Ln
- 4909 Magnolia Ln
- 4921 Magnolia Ln
- 13906 Riverwood Blvd
- 13408 Shady Ln
- 13410 Shady Ln
- 4929 Magnolia Ln
- 4933 Magnolia Ln
- 000 Magnolia Ln
- 130 Magnolia Ln
- 4933 Magnolia Ln
- 4922 Magnolia Ln
- 13407 Shady Ln
- 13407 Shady Ln
- 13403 Shady Ln
- 4941 Magnolia Ln
- 13415 Shady Ln
- 13319 Shady Ln
- 4911 Blackberry Ln